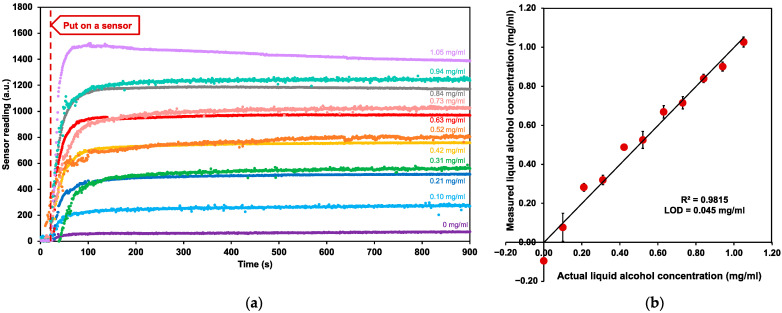
Figure 3.
The sensitivity analysis (a) Sensor reading outputs in various ethanol concentrations in the range of 0.10–1.05 mg/mL recorded from the beginning until the system reached an equilibrium state (b) Correlation between the measured alcohol concentration versus the actual alcohol concentration in artificial sweat. Each data point represents mean ± standard deviation (n = 3).

