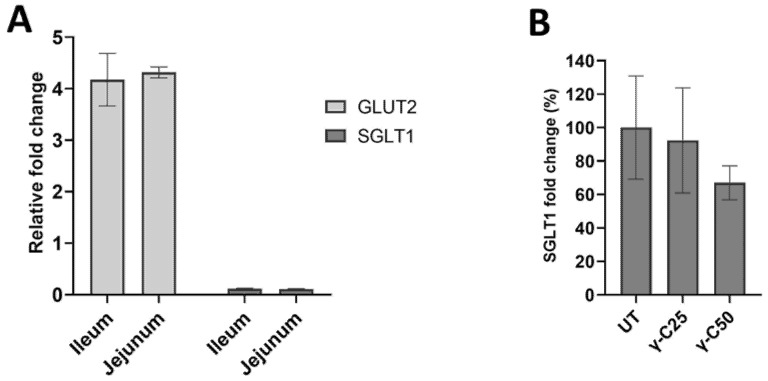
Figure 5.
Expression of SGLT1 and GLUT2 glucose transporters in intestinal tissues and the IPEC-J2 cell line. (A) Expression fold determined by RT-qPCR of SGLT1 and GLUT2 (p < 0.05). (B) Effects of the 24 h incubation of IPEC-J2 cells with 0.25 mg/mL (v/v, γ-C/culture medium, γ-C25) and 0.50 mg/mL (v/v, γ-C/culture medium, γ-C50 group) on SGLT1 protein expression, compared with the untreated group (UT) (p > 0.05). Data are expressed as mean ± standard deviation.

