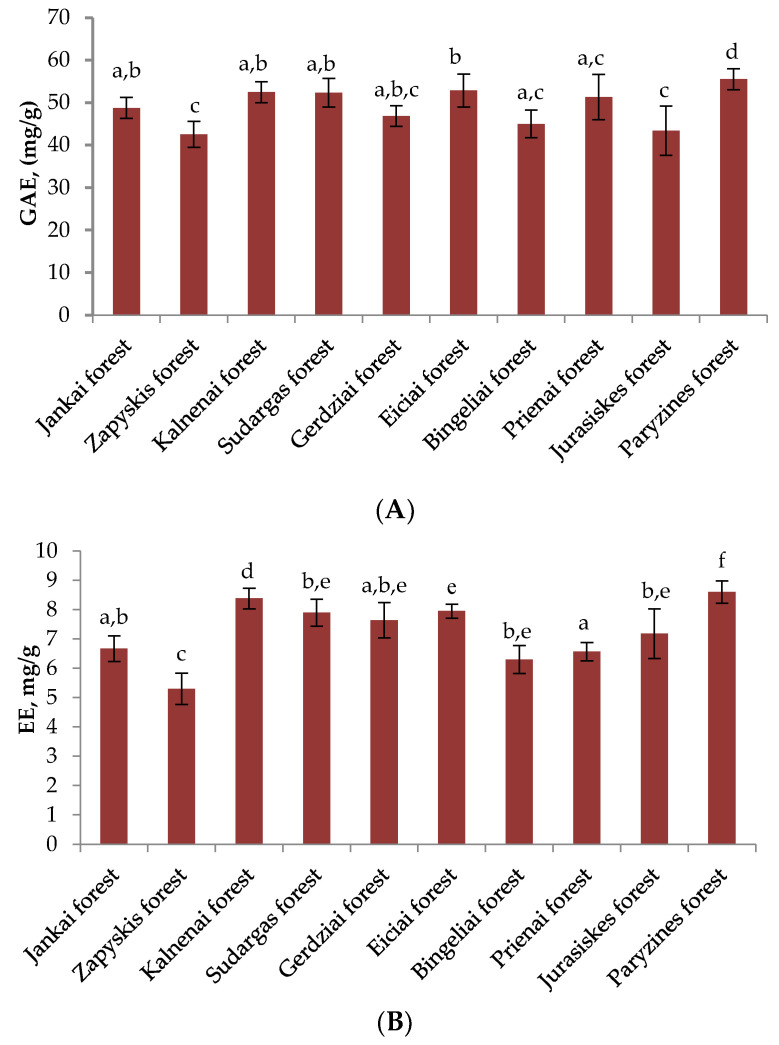
Figure 1.
(A): variation of total phenolic compounds (mg/g) content of heather samples in different habitats; (B): variation of total proanthocyanidins (mg/g) content of heather samples in different habitats. Different letters indicate statistically significant differences between heather samples (p < 0.05).

