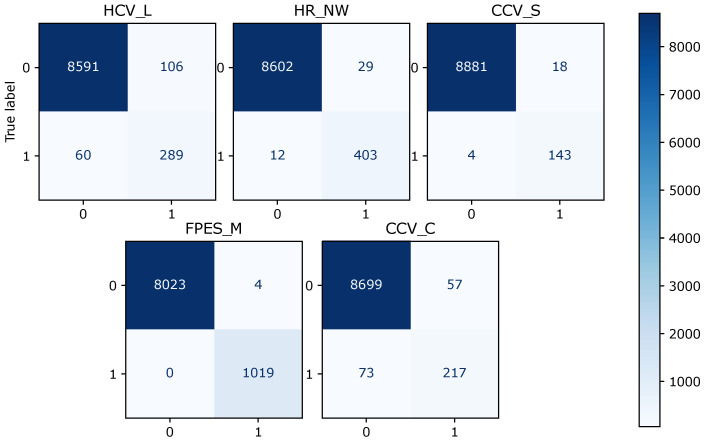
Figure 3.
Diagram of the confusion matrix of different fault classes for the logistic regression model, for five fault types. The vertical axes represent the actual labels, and the horizontal axes represent the predicted labels for the corresponding fault classes. The total number of correctly predicted samples is the sum of all actual samples labeled as true and classified as true, and the actual samples labeled as false and classified as false.

