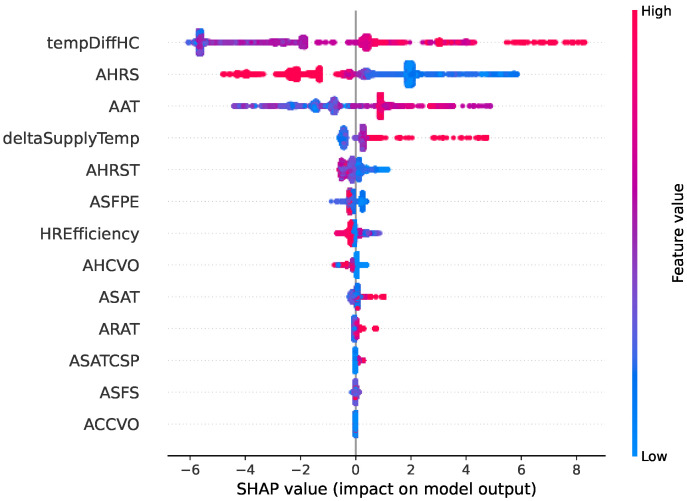
Figure 6.
Summary of the effects of all the features on the XGBoost model prediction of the fault type “Heating coil valve leak”. The SHAP values show the impact of each feature on the model output. The color represents the feature value (red shows a higher impact while blue shows a lower impact). For example, we can observe that the higher the deltaSupplyTemp (difference between supply air temperature and its setpoint), the more likely it is to indicate a heating coil valve leak.

