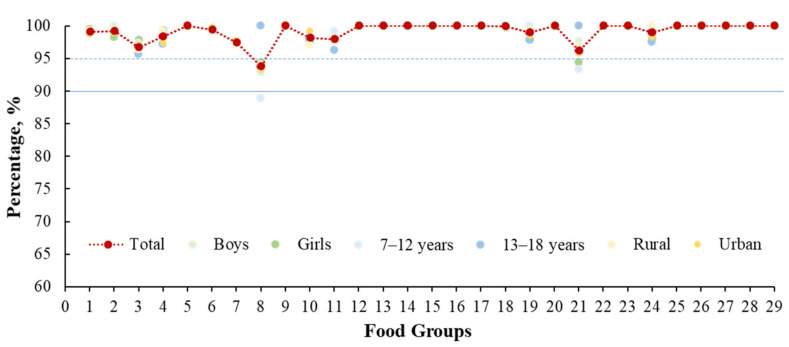
Figure 2.
Percentage (%) of the consumption of sentinel food items compared with all food items in respective 29 food groups by sex, age, and residence. Note: 1: Staple foods made from grains; 2: Whole grains; 3: White root/tubers; 4: Legumes; 5: Vitamin A-rich orange vegetables; 6: Dark green leafy vegetables; 7: Other vegetables; 8: Vitamin A-rich fruits; 9: Citrus; 10: Other fruits; 11: Grain-baked sweets; 12: Other sweets; 13: Eggs; 14: Cheese; 15: Yogurt; 16: Processed meats; 17: Unprocessed red meat (ruminant); 18: Unprocessed red meat (nonruminant); 19: Poultry; 20: Fish and seafood; 21: Nuts and seeds; 22: Packaged ultra-processed salty snacks; 23: Instant noodles; 24: Deep fried foods; 25: Fluid milk; 26: Sweetened tea/coffee/milk drinks; 27: Fruit juice; 28: Sugar-sweetened beverages (sodas); 29: Fast food.

