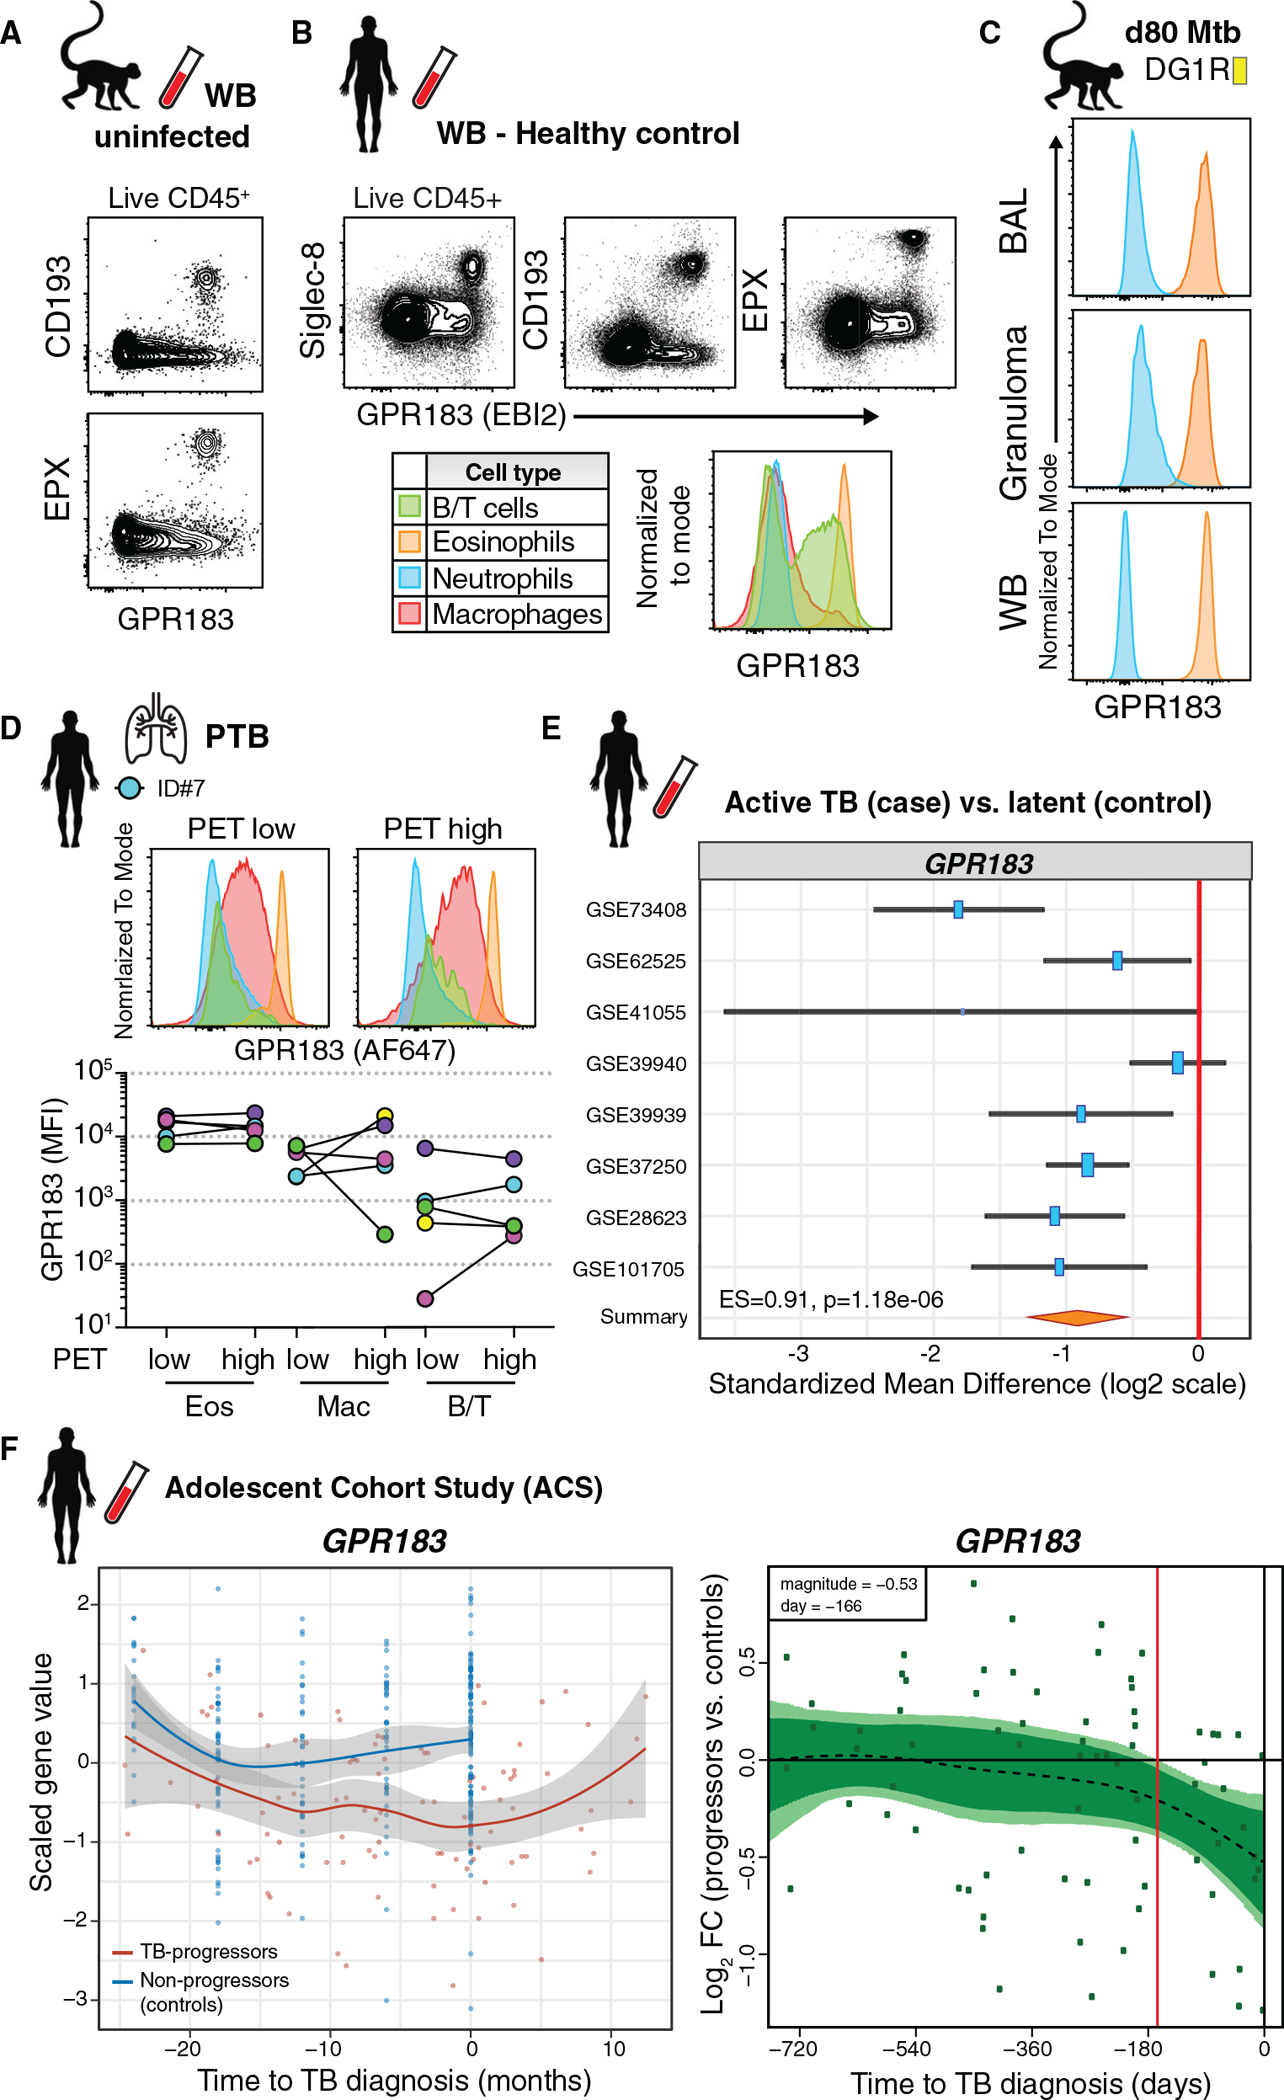
Figure 4. Human and rhesus macaque eosinophils express uniformly high levels of the oxysterol receptor GPR183.

(A) Representative FACS plots of GPR183 expression on eosinophils in WB of uninfected macaques.
(B) Representative FACS plots of GPR183 expression on leukocytes and eosinophils in WB from healthy donors.
(C) Example GPR183 expression of granulocytes after Mtb infection in BAL, WB, and granuloma of macaque DG1R.
(D) GPR183 expression by flow cytometry on immune cells in 18FDG PET/CT low or high FDG uptake in human TB lung lesions (n = 5).
(E) GPR183 expression from transcriptome profiles of LTBI controls (n = 433) or ATB (n = 528) blood samples across 8 indicated cohorts (z-test on summary effect size computed as Hedges’ g).
(F) GPR183 expression kinetics over time from adolescent cohort study. Left-side graphs depicts treatment follow-up from 42 subjects that progressed to active TB (red) and 109 latently infected controls (blue) (local regression model, Hedge’s g) and GPR183 mRNA expression over time, expressed as log2 fold change (FC) between bin-matched progressors (n = 44) and controls (n = 106) and modeled as nonlinear splines (dotted line). Right-side graph shows progressors, with light green shading representing 99% CI and dark green shading 95% CI temporal trends, computed by performing 2,000 spline-fitting iterations after bootstrap resampling from the full dataset. Deviation time (day −166) is calculated as the time point at which the 99% CI deviates from a log2 fold change of 0, indicated by the vertical red line.
