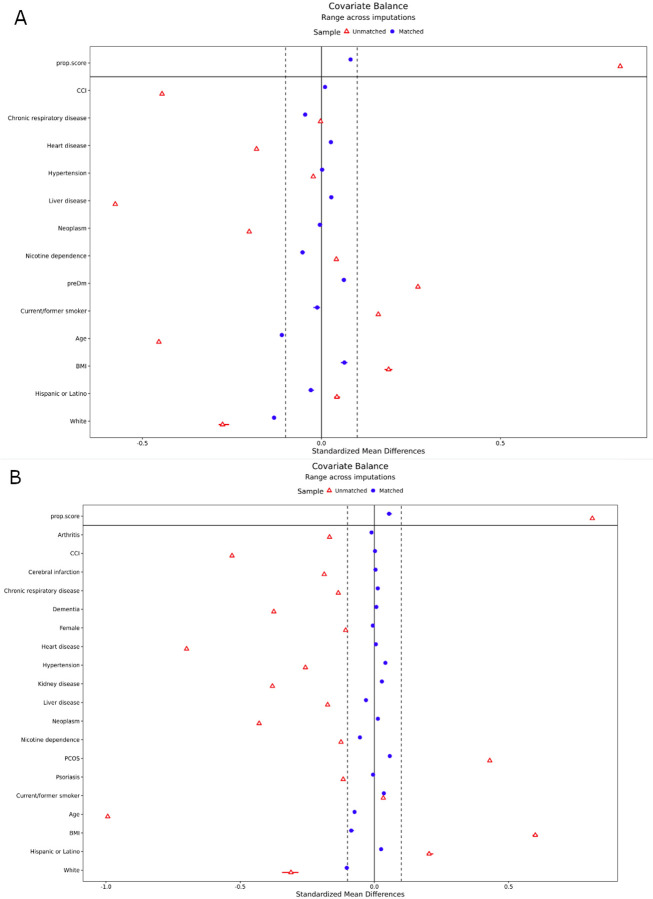
Figure 2. Inverse probability weighting in PCOS and prediabetes cohorts.
Both PCOS (A) and prediabetes (B) cohorts were balanced using an inverse probability weighting approach. The standardized mean difference (x axis) is shown for each of 19 covariates (y axis) and the overall propensity score. Red triangles indicate the original covariate balance and blue circles indicate the covariate balance after weighting.

