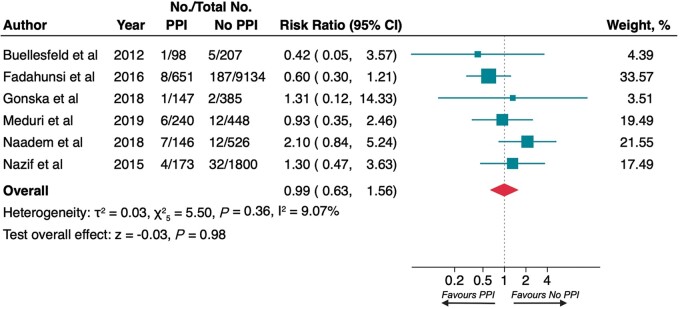
Figure 4.
Risk of myocardial infarction at 1 year. Squares represent risk ratios, with the size of the squares indicating weight of the studies and horizontal lines representing 95% CIs. The diamond represents the pooled risk ratio with the points of the diamond representing 95% CIs. CIs, confidence intervals.

