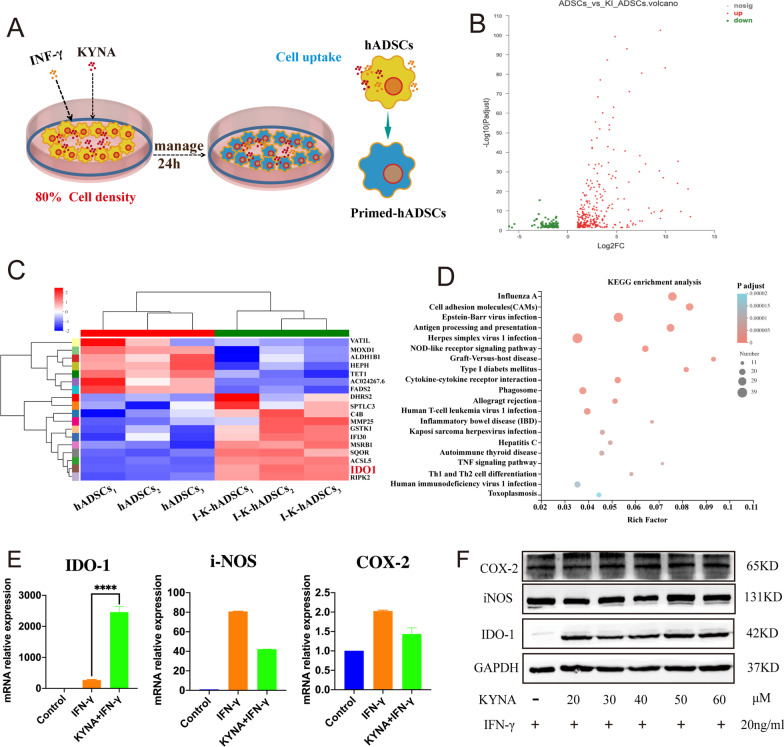
Fig. 1.
IDO-1 of hADSCs induced by pretreated IFN-γ combined with KYNA. (A) IFN-γ (20 ng/mL) combined with KYNA (50 μM) stimulated P5 hADSCs pattern. (B) Volcano plot of P5 I + K-hADSCs and hADSCs transcriptome sequencing. (C) Cluster analysis of hADSCs and IFN-γ and I + K-hADSCs. (D) KEGG enrichment analysis of hADSCs and I + K-hADSCs. (E) qPCR results of each group treated or untreated for 24 h, mRNA expression levels of IDO-1, iNOS and COX-2 in Control group (P5 hADSCs), IFN-γ group (IFN-γ 20 ng/ml treated P5 hADSCs), KYNA + IFN-γ group (IFN-γ 20 ng/ml, KYNA 50 μM treated P5 hADSCs). (F) Western blot detected the hADSCs and I + K-hADSCs protein expression levels of IDO-1, iNOS, and COX-2. Data are represented as mean ± SEM

