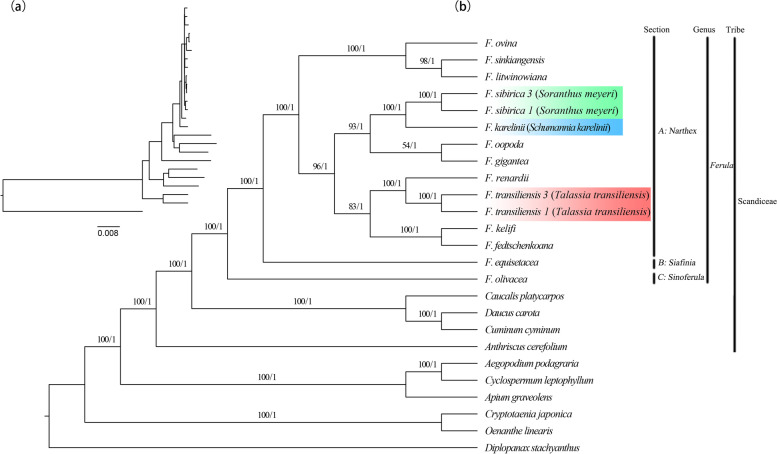
Fig. 6.
a Branch length diagram of the phylogenetic tree. b Phylogenetic tree of the 25 species inferred from maximum likelihood (ML) and Bayesian inference (BI) analyses based on the complete plastomes. The Shimodaira-Hasegawa-like support values approximate the likelihood ratio test (only F. oopoda and F. gigantea had SH-aLRT values below 80 in the terminal branch), and ultrafast bootstrap values (UFBS ≥ 95%, on the right) are shown on the branches. Green indicates two sequences of S. meyeri (F. sibiraca), blue indicates one sequence of S. karelinii (F. karelinii), and red indicates two sequences of T. transiliensis (F. transiliensis)

