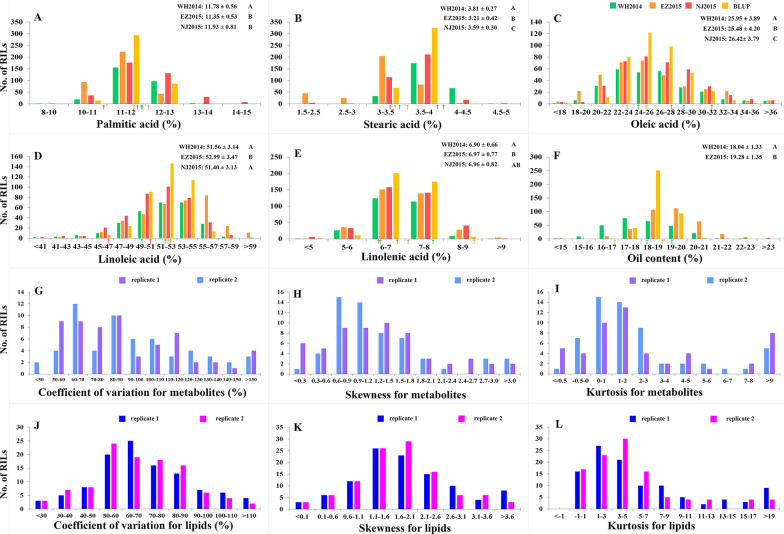
Fig. 2.
Frequency distributions for seed oil-related traits and variation characteristics of metabolites/lipids in 398 soybean RILs. A–E Seed fatty acid constituents. F Seed oil content. G, J Coefficients of variation. H, K Skewness. I, L Kurtosis. WH2014: Wuhan in 2014 (green); EZ2015: Ezhou in 2015 (orange); NJ2015: Nanjing in 2015 (red); BLUP: best linear unbiased prediction (yellow). The mean phenotypes of two parents for oil-related traits in each environment are indicated by arrows with different colors. LSD was used to test the significance of differences between various environments, and the significance was marked by different characters. All the data are indicated by mean ± standard deviation

