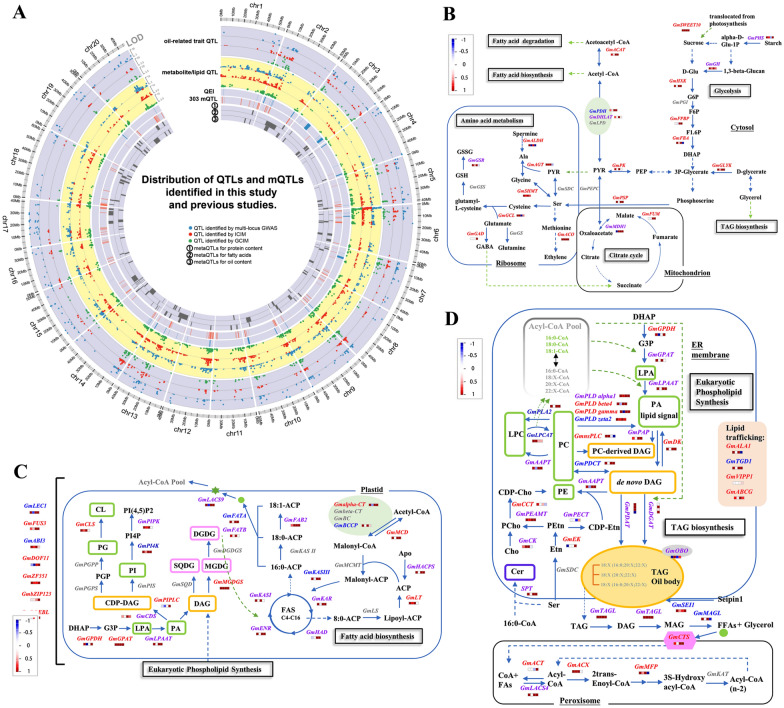
Fig. 4.
Genomic distribution of QTLs and primary metabolic pathways for metabolites/lipids and oil-related traits. A QTLs. Meta-QTLs were derived from Qi et al. [102]. In each circle, the dots with larger LOD score are closer to outer margin. B Glycolysis, citrate cycle, and amino acid metabolism. C Fatty acid biosynthesis. D TAG biosynthesis and eukaryotic phospholipid synthesis. blue: candidate genes for oil-related traits; red: candidate genes for metabolites/lipids; purple: candidate genes commonly for oil-related traits and metabolites/lipids; grey: genes derived from other studies. Four small blocks close to each gene represent log2 (Fold Change) transcript levels between high- and low-oil accessions at four stages (15, 25, 35, and 55 days after flowering). All the abbreviations can be found in Additional file 1: Table S15

