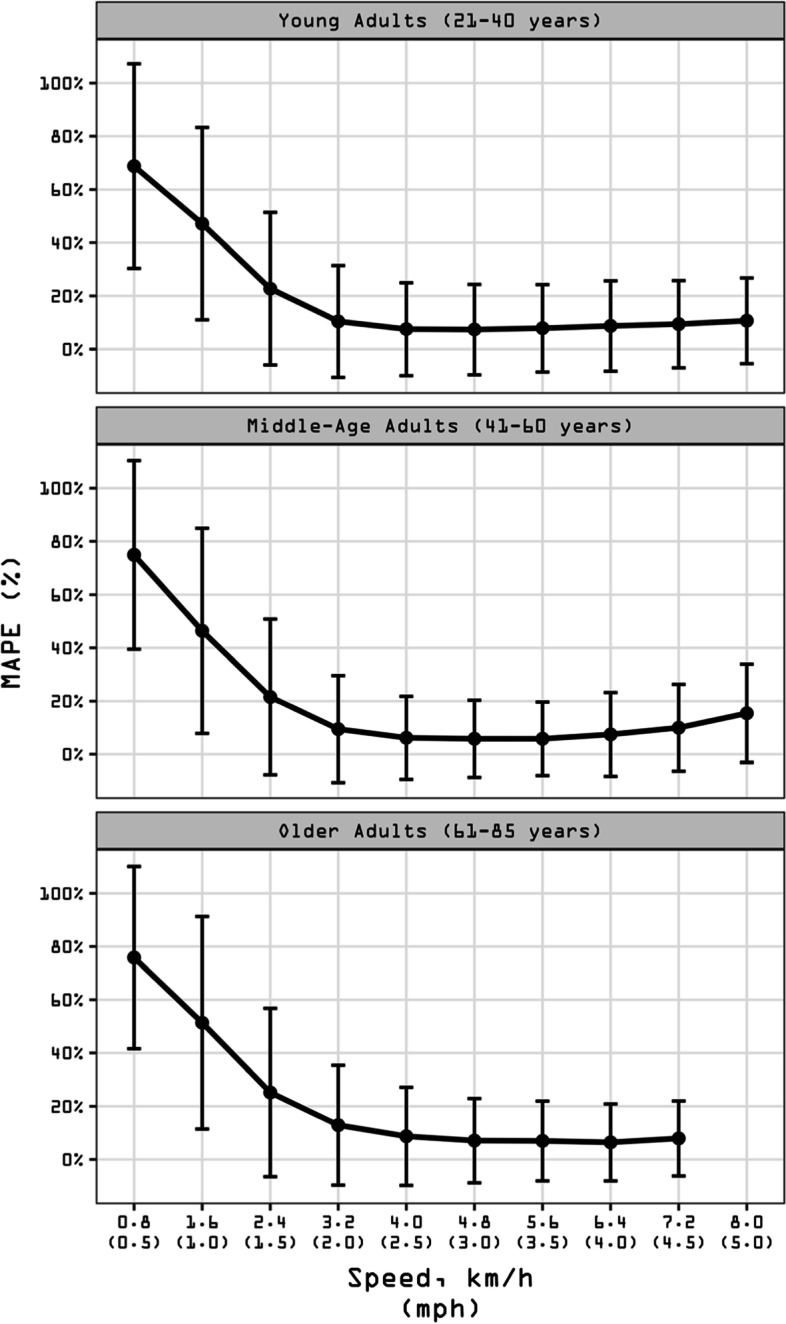
Fig. 3.

Mean absolute percentage error (MAPE) across walking speeds presented by age group. Participants walked on a treadmill for 5-min bouts beginning at 0.8 km/h (0.5 mph) and increasing in 0.8 km/h (0.5 mph). MAPE (%) was computed for each person bout subtracting the directly observed steps (criterion measurement) from the wearable technology-derived steps and dividing it in absolute value by the directly observed steps. Black dots represent the averaged MAPE across specific age group for a given speed. Bars represent standard deviation of MAPE. The standard deviation bars were not drawn when they were shorter than the height of the symbol. Lower MAPE values indicate higher age group accuracy. All age groups (21–85 years) wore the Actical (N = 250), ActiGraph GT9X (Waist) (N = 254), ActiGraph GT9X (Wrist) (N = 254), activPAL (N = 249), Digi-Walker SW-200 (N = 258), GENEActiv (Waist) (N = 224), GENEActiv (Wrist) (N = 217), NL-1000 (N = 258), and the StepWatch (N = 253). Young Adults (21–40 years) also wore the Fitbit One (N = 80) and Garmin vivofit 2 (N = 80). Middle-Age Adults (41–60 years) also wore the Apple Watch Series 1 (N = 76), Fitbit One (N = 80), Garmin vivoactive HR (N = 77), Garmin vivofit 3 (N = 77), and the Samsung Gear Fit2 (N = 80). Older Adults (61–85 years) also wore the AppleWatch Series 1 (N = 98), Fitbit Ionic (N = 98), Fitbit Zip (N = 98), Garmin vivoactive 3 (N = 96), PiezoRx (N = 98), Polar M600 (N = 97), and the Samsung Gear Fit2 Pro (N = 98). See Additional file 2 for a graphical classification of wearable technologies by age groups. See Additional File 8: Suppl Table 2 for a tabular description of validity indices by age groups
