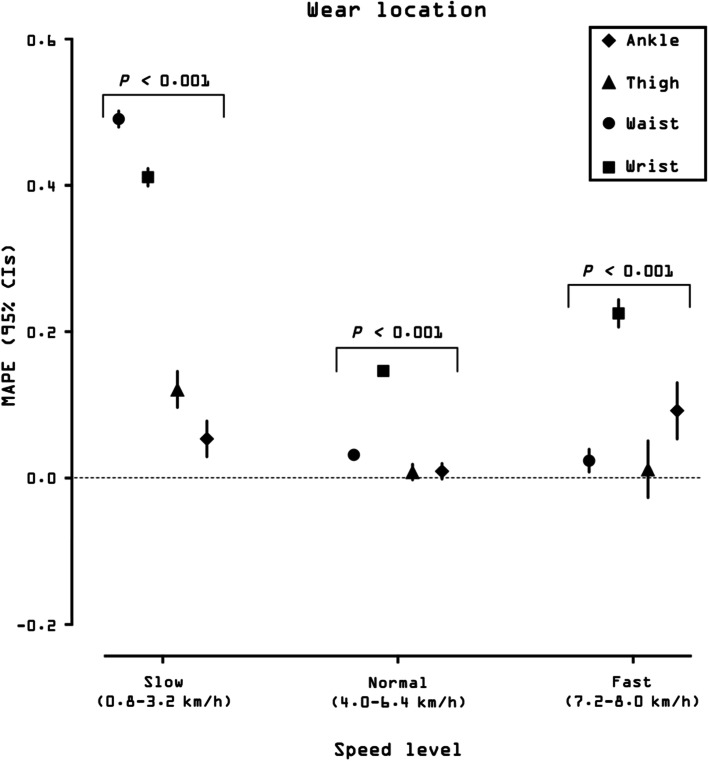
Fig. 5.
Effect of wear location on overall accuracy (mean absolute percentage error, MAPE) of wearable technologies’ step counting ability. MAPE and corresponding 95% confidence intervals (CIs; estimated using mixed effect models) of each wear location are presented at slow, normal, and fast walking speeds. Slow speed bouts: 0.8, 1.6, 2.4, 3.2 km/h (0.5, 1.0, 1.5, 2.0 mph); normal speed bouts: 4.0, 4.8, 5.6, 6.4 km/h (2.5, 3.0, 3.5, 4.0 mph); fast speed bouts: 7.2, 8.0 km/h (4.5, 5.0 mph). MAPE values were averaged across devices respective to each wear location for slow, normal, and fast walking speeds. MAPE values closer to 0 indicate greater accuracy. The 95% CIs bars were not drawn when they were shorter than the height of the symbol. Further, where 95% CIs do not overlap, there are significant differences between locations. Likelihood ratio test P value is reported for the effect of wear location on MAPE for each specific speed level. Ankle-worn wearable: StepWatch (N = 253). Thigh-worn wearable: activPAL (N = 249). Waist-worn wearables: Actical (N = 250), ActiGraph GT9X (N = 254), Digi-Walker SW-200 (N = 258), Fitbit One (N = 160), Fitbit Zip (N = 98), GENEActiv (N = 224), NL-1000 (N = 258), PiezoRx (N = 98). Wrist-worn wearables: ActiGraph GT9X (N = 254), Apple Watch Series 1 (N = 174), Fitbit Ionic (N = 98), Garmin vivoactive 3 (N = 96), Garmin vivoactive HR (N = 77), Garmin vivofit 2 (N = 80), Garmin vivofit 3 (N = 77), GENEActiv (N = 217), Polar M600 (N = 97), Samsung Gear Fit2 (N = 80), Samsung Gear Fit2 Pro (N = 98). See Additional file 2 for a graphical classification of wearable technologies by age groups

