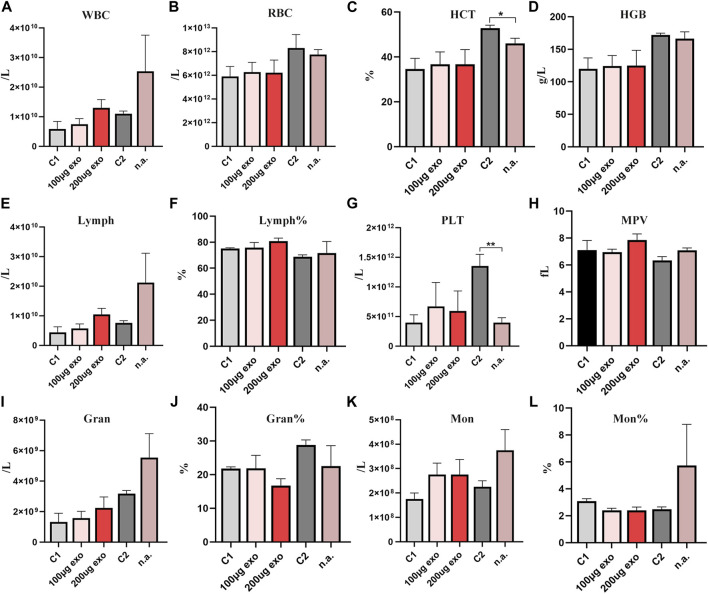
FIGURE 5.
Routine blood analyses of SD rats on day 1. (A) White blood cell count. (B) Red blood cell count. (C) Hematocrit (*p < 0.05). (D) Hemoglobin. (E) Lymphocyte count. (F) % Lymphocytes. (G) Platelet count (**p < 0.01). (H) Mean platelet volume. (I) Neutrophil count. (J) % Neutrophils. (K) Monocyte count. (L) % Monocytes. N = 4 per group. Data are expressed the mean ± SEM. (C1, Control 1; C2, Control 2). Reference ranges: WBCs. 2.9–15.3 × 10⁹/L; RBCs, 5.60–7.89 × 10¹²/L; HCT 36%–46%; HGB, 120–150 g/L; Lymph, 2.6–13.5 × 10⁹/L; Lymph%, 63.7%–90.1%; PLT, 100–1,610 × 109/L; MPV, 3.8–6.2 fL; Gran. 0.4–3.2 × 10⁹/L; Gran% 7.3%–30.1%; Mon, 0–0.5 × 10⁹/L; Mon%, 1.5%–4.5%.

