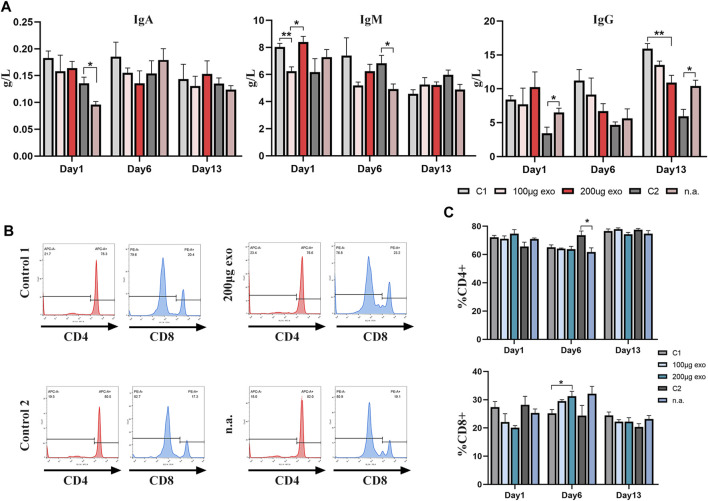
FIGURE 7.
Effects of hiPSC-exosomes on humoral and cellular immunities. (A) Changes of IgA, IgM, and IgG contents in the four groups of rats on days 1, 6, and 13. N = 4 per group (*p < 0.05; **p < 0.01). (B) Representative histograms of tail vein and nasal administration of hiPSC-exosome groups and their control groups in flow cytometry. (C) Analysis of changes in the ratios of CD4+ and CD8+ T-cells on days 1, 6, and 13. N = 4 per group (*p < 0.05). Data are expressed as the mean ± SEM.

