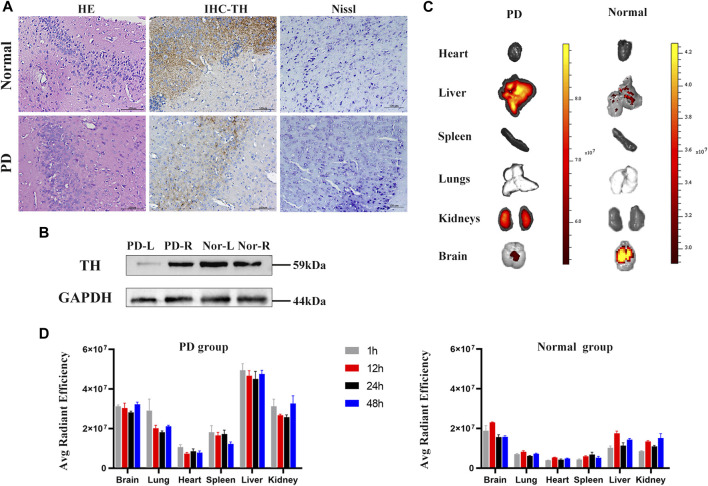
FIGURE 8.
Parkinson’s mouse model test and in vivo organ imaging. (A) HE staining, IHC of tyrosine hydroxylase, and Nissl-stained sections of control and PD groups. (B) Contents of tyrosine hydroxylase in left and right brain hemispheres of PD and control mice measured by western blotting. (C) Representative fluorescence images of organs in control and PD groups. (D) Fluorescent intensity of major organs at 1, 12, 24, and 48 h. N = 3 per group. Data are expressed as the mean ± SEM.

