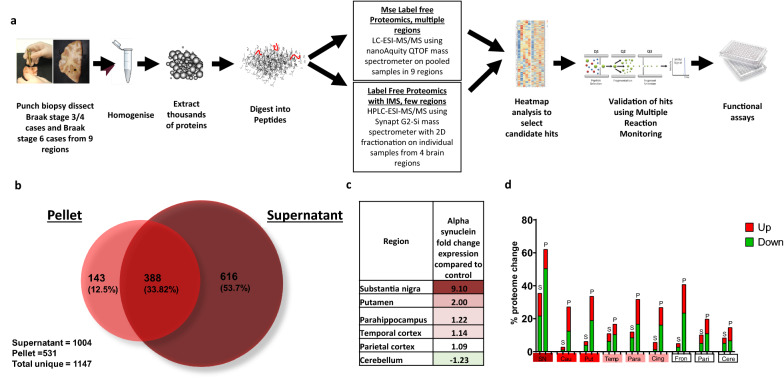
Fig. 2.
Workflow of methodology. a Flowchart highlighting methods used within the experiment. Tissue was micro-dissected per region, tissue homogenised and proteins were extracted and digested into peptides. Samples were proteome profile using mass spectrometry. Candidates were selected before confirmatory targeted Multiple Reaction Monitoring LCMS/MS analysis was completed. Functional assays were performed. b Venn diagram indicating how many proteins were detected uniquely in the supernatant and pellet fractions and how many overlapped. c Heat map of alpha-synuclein expression as fold change in Braak stage 3/4 compared to control indicated by colour. Red indicated upregulation and green downregulation compared to controls with deeper colour indicating a higher level of change. White indicates no change in expression compared to controls. d Overall change in the brain proteome for each region and condition expressed as a percentage of total proteome either upregulated (red) or downregulated (green) by more than 1.5 fold. S represents the supernatant fraction and P represents the pellet fraction. Graph created in GraphPad Prism v8

