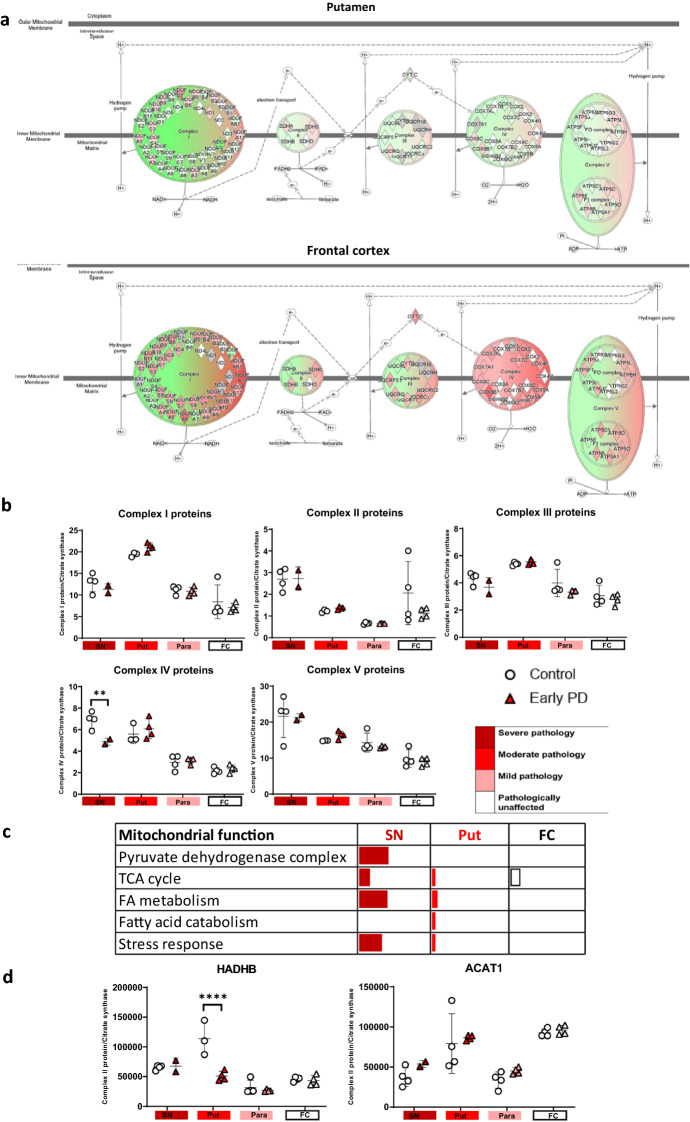
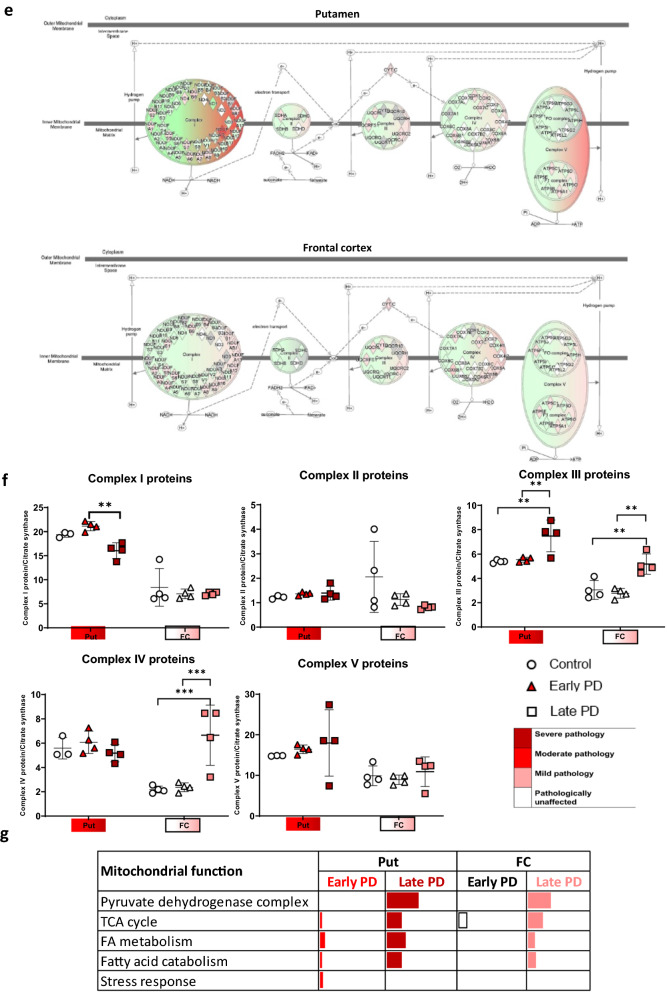
Fig. 6.
Mitochondrial analysis of label free proteomic data. Oxidative phosphorylation pathway diagram with per region overlay of proteomic expression for the putamen and frontal cortex in early PD compared to controls, a and late PD compared to controls, e. Red represents upregulation and green represents downregulation. Intensity of colour indicates level of altered expression. b, f Complex proteins totalled and ratioed to citrate synthase across brain regions and disease stages. Two-way ANOVA with Sidek’s multiple comparison post-hoc testing was performed for each complex/citrate synthase and statistically significant results are demonstrated on graphs with * representing p < 0.03, ** representing p < 0.002, *** representing p < 0.0002 and **** representing p < 0.0001. Bars represent SEM. c, g Table indicating the % of significantly altered proteins per pathway for the sub-functions of the mitochondria as determined through Mitominer and Panther. Regions are colour-coded for severity of pathology present at that stage of disease as shown in key. d HADHB and ACAT1 expression across multiple brain regions, Graphs and statistics were completed using GraphPad Prism v8


