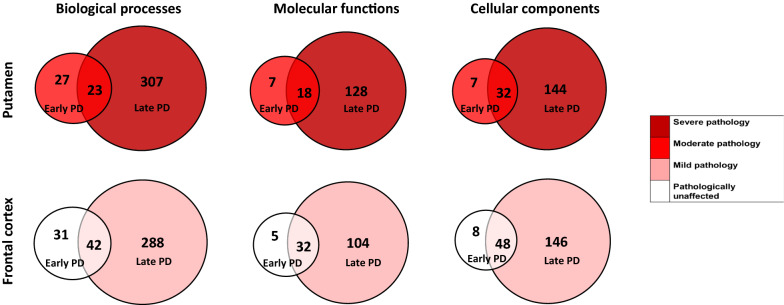
Fig. 7.
Early stage PD overlap against Late stage PD. Pie charts show the number of GO terms (Biological processes, molecular functions or cellular components) that are overlapping between early PD (Braak stage 3/4) and late stage PD (Braak stage 6) in either the putamen, a region moderately affected at Braak stage 3/4 but severely affected at Braak stage 6, and the frontal cortex, a region not affected at Braak stage 3/4 but mildly affected at Braak stage 6. Colour coded for severity of pathology present at that stage of disease as shown in key

