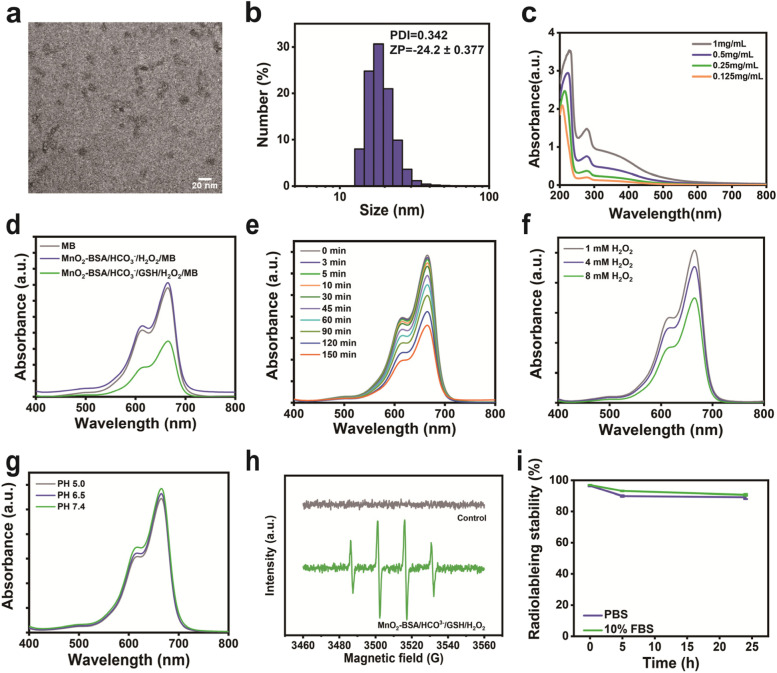
Fig. 1.
Characterization of MnO2-BSA NPs. (a) TEM images of MnO2-BSA. (b) Size distribution of MnO2-BSA determined by DLS in PBS. (c) UV–vis absorbance spectra of MnO2-BSA with different concentrations in PBS. (d) UV-Vis absorption spectra of MB after degradation by the MnO2-BSA -mediated Fenton-like reaction in different solutions. (e) The degradation process of MB at different time points. (f) The degradation process of MB under different concentration of H2O2. (g) The degradation process of MB under different PH. (h) EPR spectra of different groups, where the 5,5-dimethyl-1-pyrroline N-oxide (DMPO) served as the spin trapping agents to detect the •OH generation during the reaction. (i) Radiolabeling stability of 211At-ATE-MnO2-BSA in PBS and 10% FBS

