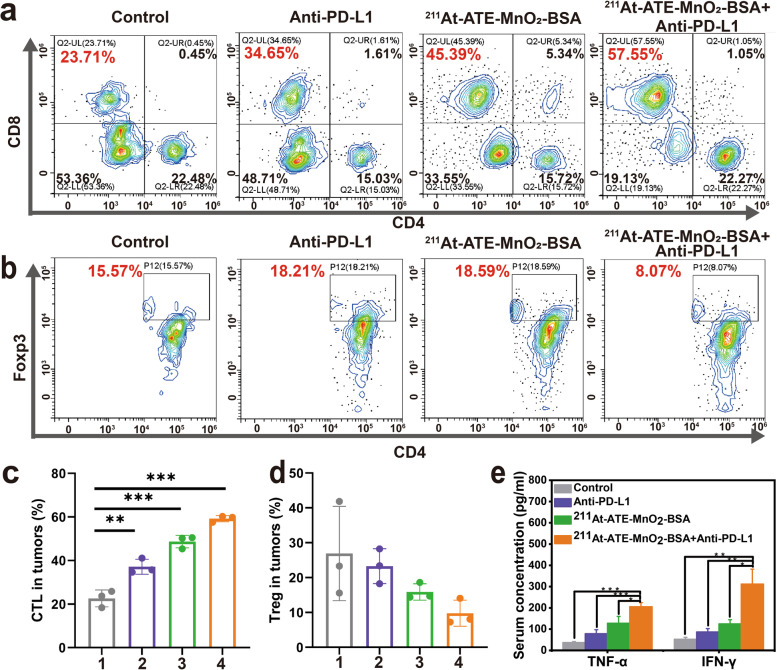
Fig. 4.
Activated immune response tests by TAT/CDT/ICB. (a-b) Representative flow cytometry plots showing T cells (a) and Treg cells (b) in the distant tumors from different groups 10 days post-treatment (CT26 tumor model). (c) Proportions of tumor-infiltrating CD8+ killer T cells among CD3+ cells (CT26 tumor model). Error bars represent mean ± s.d. (n = 3). (d) Proportions of Treg cells in tumor. Error bars represent mean ± s.d. (n = 3). (e) TNF-α level and interferon-γ (IFN-γ) level in mice sera post-various treatments (CT26 tumor model). Note, 1: Control, 2: Anti-PD-L1, 3: 211At-ATE-MnO2-BSA, 4: 211At-ATE-MnO2-BSA + Anti-PD-L1. P values were calculated by t-test (*P<0.05, **P < 0.01 and ***P < 0.001)

