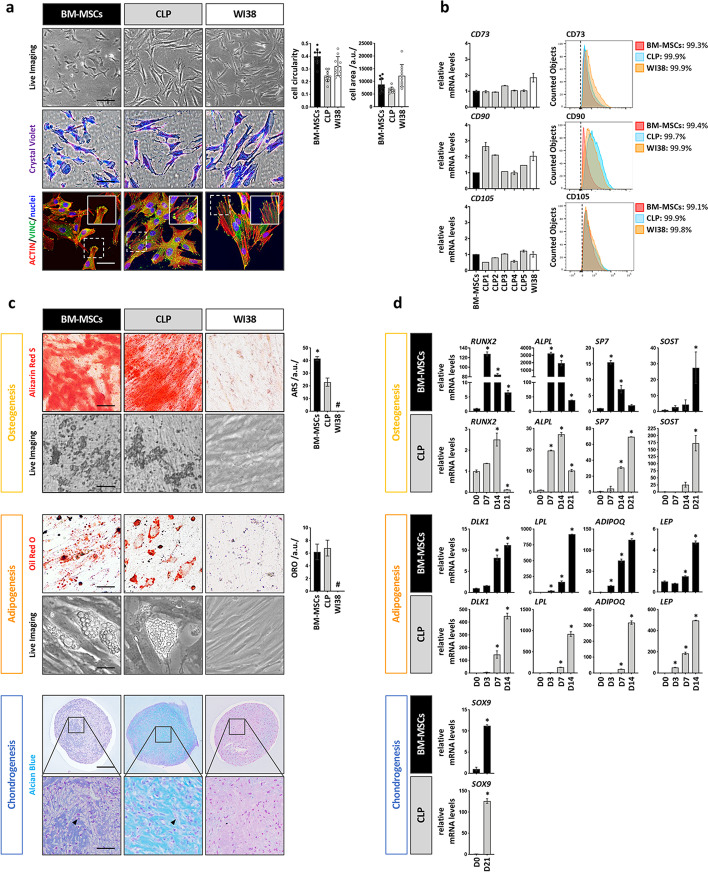
Fig. 2.
Evaluation of the 3 main MSCs-like properties in CLP lip fibroblasts. a Live, brightfield, and IF images of BM-MSCs, a CLP lip fibroblast culture and WI38 lung fibroblasts cell line. Scale bars: 100 µm (Live Imaging), 50 µm (CV), 20 µm (IF). Vinculin (VINC, green); actin (red); nuclei (blue). Histograms to the right report the cc and cell areas of the three cell populations analyzed in 50 individual cells. a.u.: arbitrary unit. b qPCR (left) and FACS analysis (right) for the MSCs surface markers CD73, CD90, and CD105 in BM-MSCs (set to 1), CLP1–CLP5 (FACS: CLP1 only is shown) and WI38. Black dashed lines in the FACS plots indicate the threshold of unstained samples. The percentage of positive cells for each sample is reported. Gating strategy is presented in Additional file 1: Fig. S6. c At the end of the differentiation time mineralization (yellow box), lipid droplet accumulation (orange box) and presence of cartilage-related ECM components (blue box) in BM-MSCs, a CLP culture, and WI38 were assessed by ARS, ORO and AB staining, respectively. For osteogenesis and adipogenesis live imaging pictures are also shown (day 21 and day 14, respectively). Quantifications of ARS and ORO by ImageJ are reported on the right. Arrows in the AB pictures indicate hypertrophic cells. Scale bars: 5 µm (ARS, ORO and Live Imaging); 200 µm (AB); 20 µm (AB close-ups). *p < 0.05 BM-MSCs versus CLP. # no detected staining. a.u.: arbitrary unit. d qPCR analysis of osteogenic (RUNX2, ALPL, SP7, and SOST), adipogenic (DLK1, LPL, ADIPOQ and LEP) and chondrogenic-associated (SOX9) genes in BM-MSCs and a CLP culture at different timepoints during differentiation. The expression of each marker has been normalized to its expression at day 0 (D0). *p < 0.05

