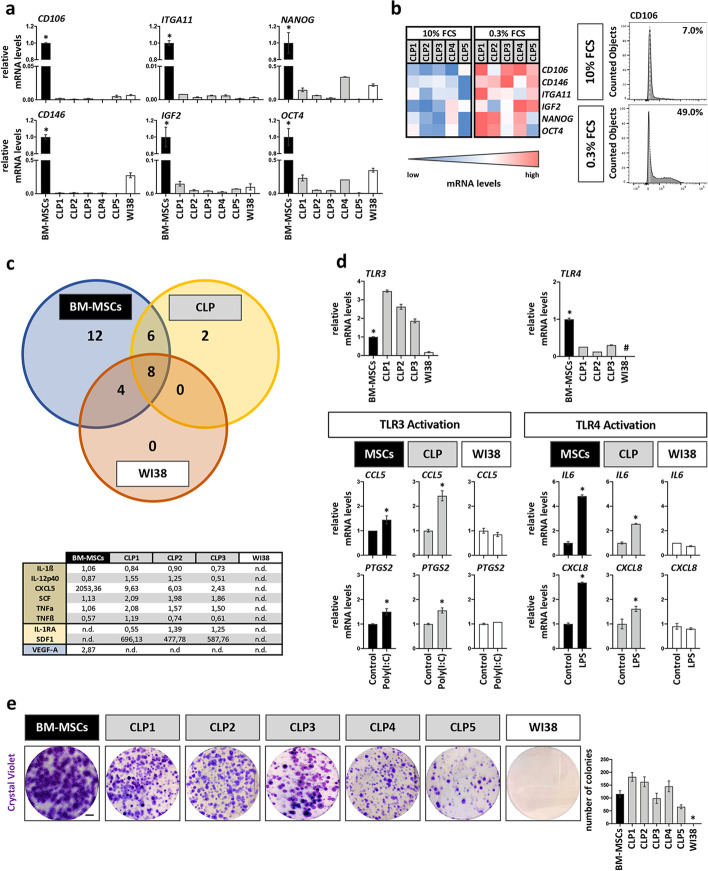
Fig. 3.
Evaluation of additional MSC-like properties in CLP lip fibroblasts. a qPCR analysis for the expression of newer MSC markers CD106, CD146, ITGA11, and IGF2, and of the embryonic pluripotency markers NANOG and OCT4 in BM-MSCs (set to 1), CLP1–CLP5 and WI38 cells. *p < 0.05 BM-MSCs versus CLP1–CLP5 or WI38. b The same set of genes was analyzed in CLP1–CLP5 under starving (0.3% FCS, 24 h) and regular (10% FCS) culturing conditions by qPCR. Absolute mRNA levels are shown in the heatmap (blue, low expression; red, high expression). Note that starvation induces the expression levels of these genes in all CLP cultures. Increased CD106+ population under low serum conditions was confirmed by FACS. White dashed lines indicate the unstained sample threshold. The percentage of positive cells is reported. Gating strategy is presented in Additional file 1: Fig. S6. c Venn diagram comparing the secretion of 32 different pro- and anti-inflammatory cytokines in the conditioned medium of BM-MSCs, a CLP culture, and WI38 cells. In the table quantification of the cytokines common to BM-MSCs and CLP or exclusive for CLP and BM-MSCs in case of VEGF-A is reported. Quantification data should be read as pg/ml. n.d. no determined. d Assessment of TLR3 and TLR4 expression in BM-MSCs, CLP1–CLP3 and WI38 by qPCR. The expression levels were normalized to BM-MSCs. *p < 0.05 BM-MSCs versus CLP1–CLP3 or WI38. # no detected gene (Ct value > 32). TLR3- and TLR4-mediated target gene expression in BM-MSCs, a CLP culture, and WI38 was analyzed by qPCR for CCL5 and PTGS2, and of IL6 and CXCL8 after activation of TLR3 by poly(I:C) and TLR4 by LPS, respectively. Note that WI38 cell line is not responsive to TLRs stimulation. The expression levels under activating conditions were normalized for each sample to their relative basal expression. *p < 0.05. e Pictures as well as quantification of single cell-derived colonies of BM-MSCs, CLP1–CLP5, and WI38 stained with CV after 14 days. Scale bar: 1 cm. *p < 0.05 WI38 versus BM-MSCs or CLP1–CLP5

