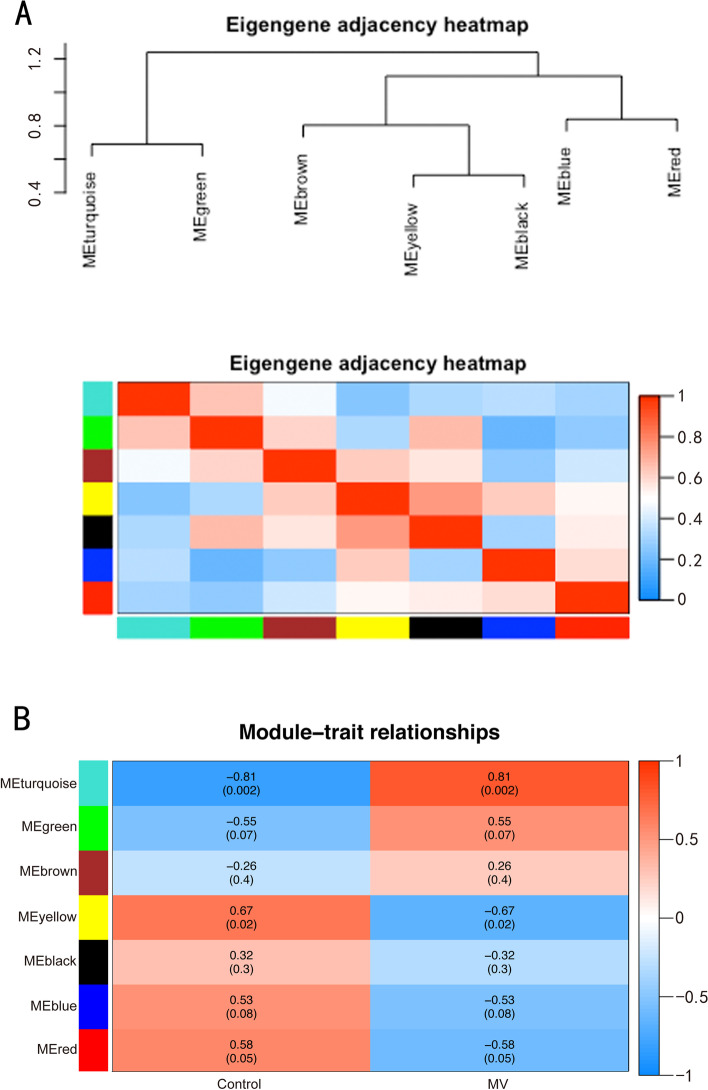
Fig. 5.
Module–trait correlations. A Eigengene adjacency heatmap. Eigengene adjacency heatmaps are depicted to indicate the connectivity among the coexpression modules. B Correlation heatmap of gene modules and group features. The turquoise and yellow modules were markedly correlated with the status of accepting mechanical ventilation (MV) and the control condition, respectively. Each column corresponds to a group feature, while each row corresponds to a module eigengene. The Pearson correlation coefficients between group features and module eigengenes and the P values are presented in each cell

