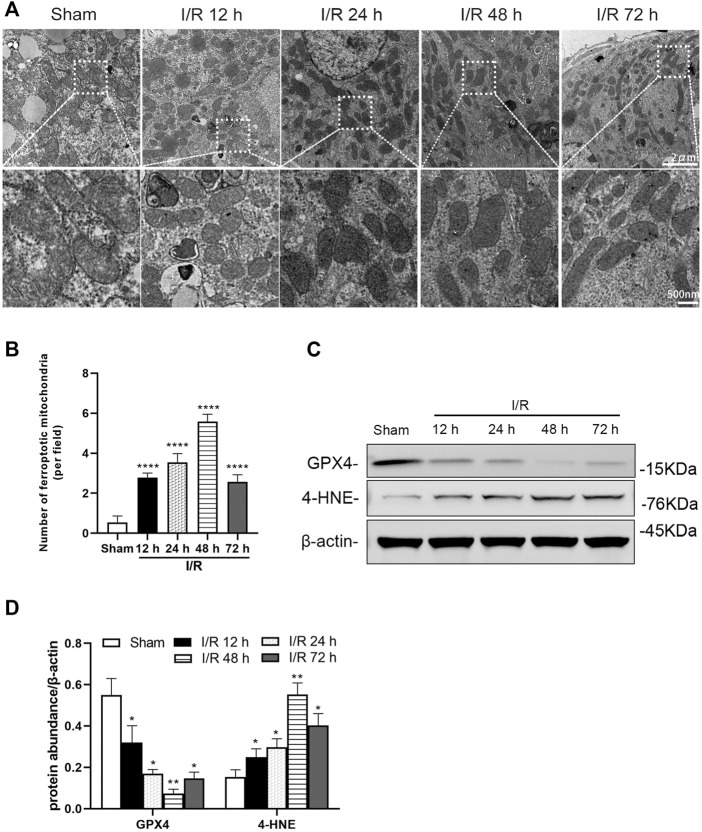
FIGURE 2.
Detection of ferroptosis in the renal tubules of mice at 12, 24, 48, and 72 h after I/R (A) Transmission electron microscopy was used to observe the mitochondria of renal tubules (B) The numbers of ferroptotic mitochondria per field in different groups were compared (C) Western blotting detection of GXP4 and 4-HNE in the renal tissue (D) Protein synthesis of GXP4 and 4-HNE in western blotting. Due to the death of mice, N = 5 for each group. Statistical significance is denoted as *: p < 0.05, **: p < 0.01, ****: p < 0.0001 compared with the sham group at the same time point.

