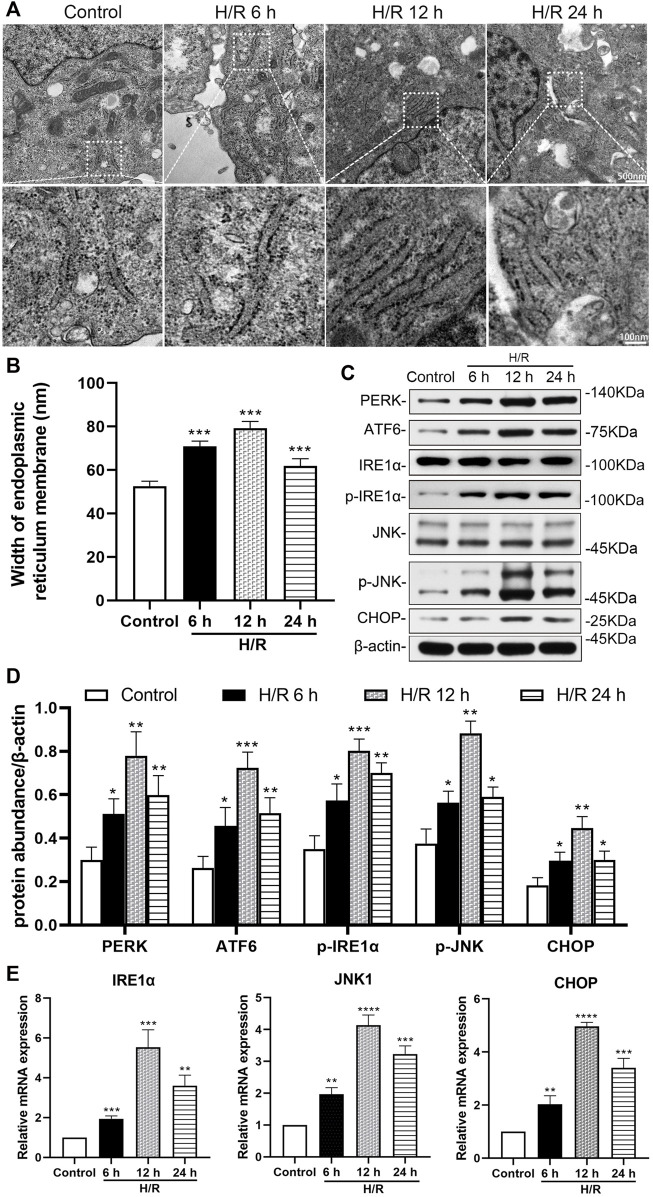
FIGURE 3.
Detection of hypoxia/reoxygenation-induced ER stress in HK-2 cells at 6, 12, and 24 h after hypoxic for 4 h (A) Transmission electron microscopy was used to observe the ER of HK-2 cells (B) The analysis of the width of ER in HK-2 cells, detected by electron microscopy (C) Representative western blotting of ER stress markers (D) Protein synthesis of ER stress production in western blotting (E) mRNA expressions of IRE1α, JNK1, and CHOP in qRT-PCR. When the hypoxia/reoxygenation (H/R) groups were compared at 6, 12, and 24 h after H/R, the expression was highest at 12 h (p < 0.0001). Statistical significance is denoted as *: p < 0.05, **: p < 0.01, ****: p < 0.0001 compared with the control group at the same time point.

