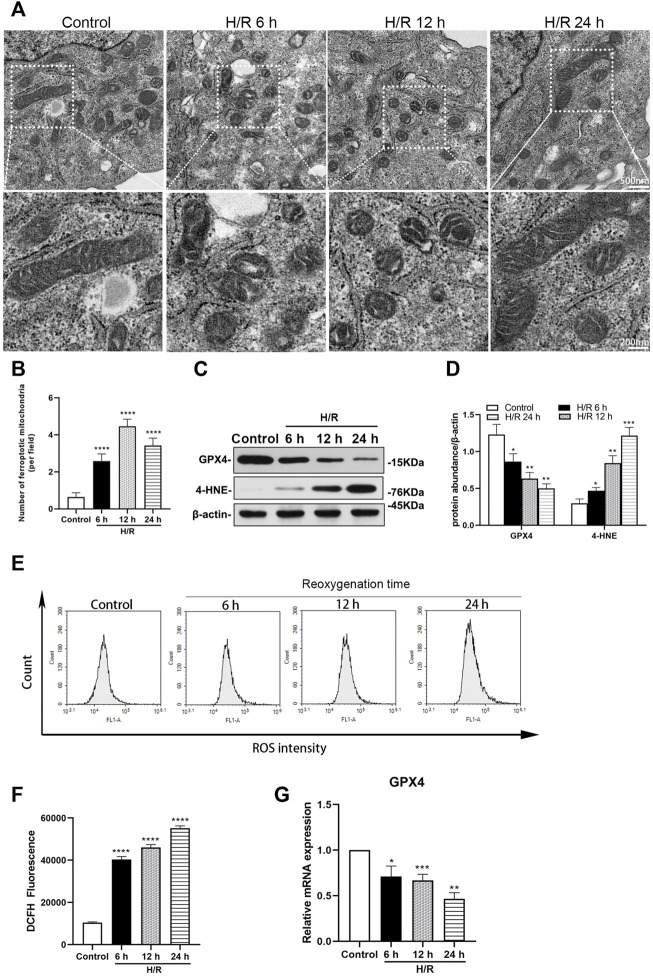
FIGURE 4.
Detection of ferroptosis in H/R HK-2 cells at 6, 12, and 24 h after H/R (A) Transmission electron microscopy was used to observe the mitochondrion of HK-2 cells (B) The number of ferroptotic mitochondria per field in different groups were compared, the number was highest at 12 h (p < 0.0001) (C) Representative western blotting of GXP4 and 4-HNE, β-actin used as an internal control (D) Protein synthesis of GXP4 and 4-HNE in western blotting (E) Flow cytometry showed that the level of reactive oxygen species (ROS) in the control group and H/R HK-2 cells (F) Analysis of ROS in flow cytometry in H/R HK-2 cells (G) mRNA expressions of GXP4 in qRT-PCR. Statistical significance is denoted as *: p < 0.05, **: p < 0.01, ***: p < 0.001, ****: p < 0.0001 compared with the control group at the same time point.

