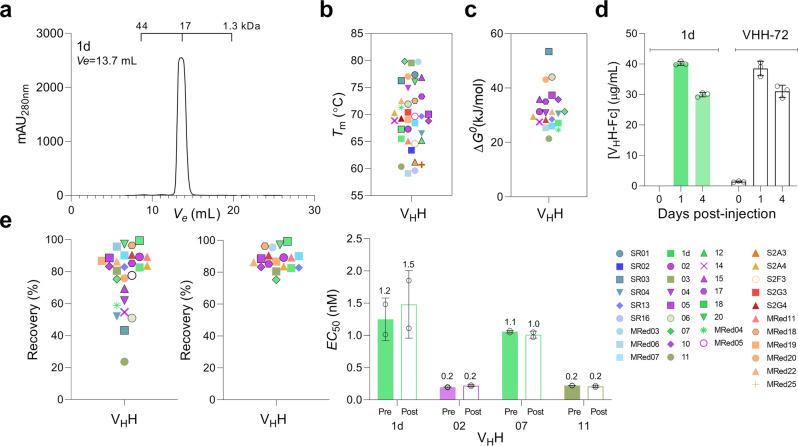
Fig. 3. Stability of anti-SARS-CoV-2 S VHHs.
a Representative SEC profile demonstrating the aggregation resistance of VHHs. The elution volume (Ve) positions of molecular mass standards (44 kDa, 17 kDa, 1.3 kDa) are marked. See Supplementary Fig. 8 for the full dataset. b Summary of VHH Tm data. Tms were obtained from plots of % folded vs temperature (Supplementary Fig. 9; Supplementary Table 5). c Summary of VHH ΔG0 data. ΔG0 (as well as other thermodynamic parameters, Cm and m values) are reported in Supplementary Table 5. d In vivo stability and persistence of VHHs. Stability and persistence were determined by monitoring the concentration of a representative VHH-Fc (1d) in hamster blood at various days post-injection by ELISA. VHH-72-Fc was used as the benchmark. Error bars indicate standard deviation (SD) of three biological replicates (animals). e Stability of VHHs against aerosolization. Summary of % recovery of all (left panel) and lead (middle panel) VHHs are shown. Percent recovery represents the proportion of a VHH that remained soluble monomer following aerosolization. Graphs were generated based on the data in Supplementary Fig. 11a and Supplementary Table 6. Open circle in e (Left panel) represents benchmark VHH-72. e (right panel) Activity of pre- vs post-aerosolized VHHs expressed in terms of antigen binding (EC50). EC50s were determined by ELISA. Error bars indicate standard deviation (SD) of two technical replicates. VHHs in b, c, e (left panel) and e (middle panel) are color-coded based on their epitope bin designation (see Fig. 1d). Source data used to generate Fig. 3a, d and e (right panel) are included in Supplementary Data 1.

