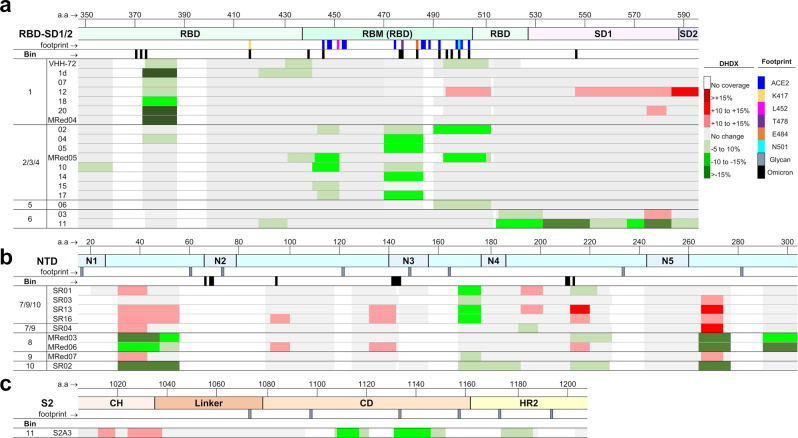
Fig. 5. Epitope mapping.
a–c HDX/MS epitope mapping of VHHs binding RBD (a), NTD (b) and S2 (c). Only relevant S2 residues are shown. Changes in deuteration are mapped as colored rectangles corresponding to primary sequences. Stabilizations are shown in green, and destabilizations are shown in red, while regions with no significant changes in deuteration are shown in gray and missing coverage in white. Key structural features are highlighted by lines below the amino acid sequence, including the ACE2 binding site (blue), mutations from VoCs, and N-linked glycans are included for reference. Source data used to generate the figure are included in Supplementary Data 1.

