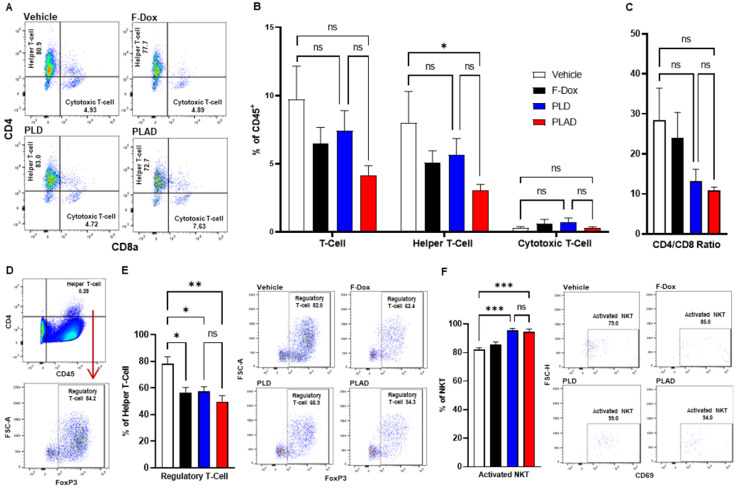
Figure 6.
PLAD decreased T regulatory cells and increased activated NKT cells in tumors. (A-B) Helper and cytotoxic T cells were identified from the CD3+ population in Figure 5C. There were no significant differences in the total tumor infiltrating T cell population. However, further inspection showed that there was a significant decrease in helper T cells in PLAD treated animals. There was no significant impact on cytotoxic T cells for any treatment. (C) PLAD showed a decreased CD4/CD8 ratio, but it was not statistically significant. (D) T regulatory cells were gated from live cells (Supplemental Figure S4). (E) PLAD, PLD, and F-Dox significantly decreased the infiltration of regulatory T cells in tumors. (F) PLAD and PLD also increased the activation of NKT cells in tumors. Representative FACS plots are shown. Data are mean with SEM, n=9 for PLAD, PLD, and F-Dox, n=5 for vehicle; ANOVA with Tukey's test; *p<0.05, **p<0.01, and ***p<0.001. F-Dox: free doxorubicin, PLD: pegylated liposomal doxorubicin, PLAD: pegylated liposomal alendronate doxorubicin, NKT: natural killer T-cells.

