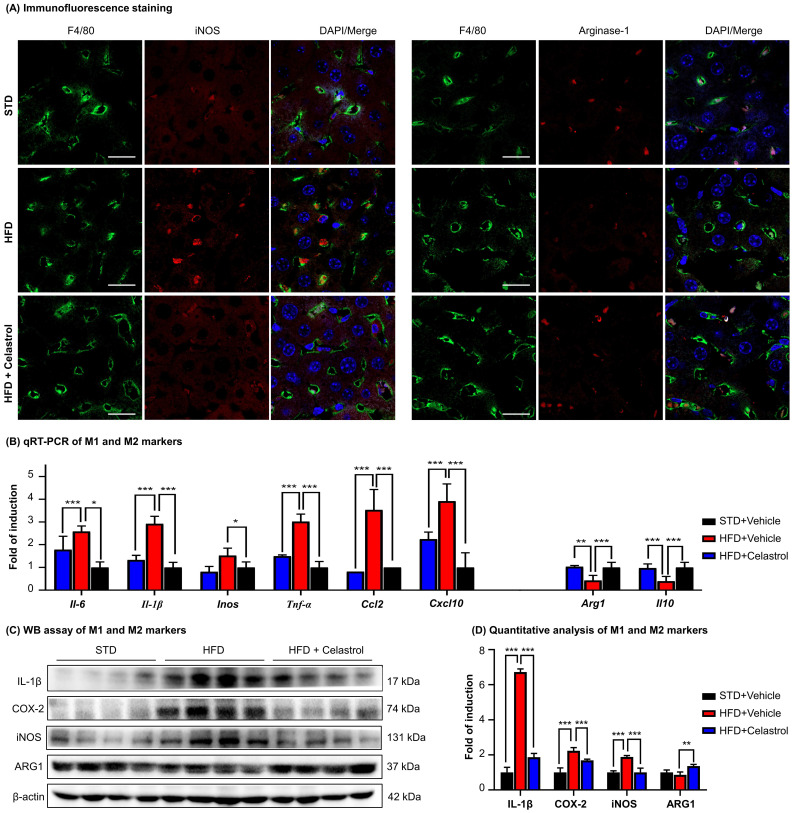
Figure 6.
Celastrol skewed hepatic macrophage M1/M2 polarization in NAFLD mice. (A) Detection of iNOS and arginase-1 in livers. F4/80 was stained as macrophage biomarker. The cell nuclei were detected with DAPI. Scale bar: 20 µm. (B) qRT‐PCR quantification of M1 macrophage biomarkers and M2 macrophage biomarkers. (C) WB analysis of macrophage polarization biomarkers (n=4). (D) Quantitative analysis of macrophage polarization biomarkers. * p < 0.05, ** p < 0.01, ***p < 0.001 (HFD vs others).

