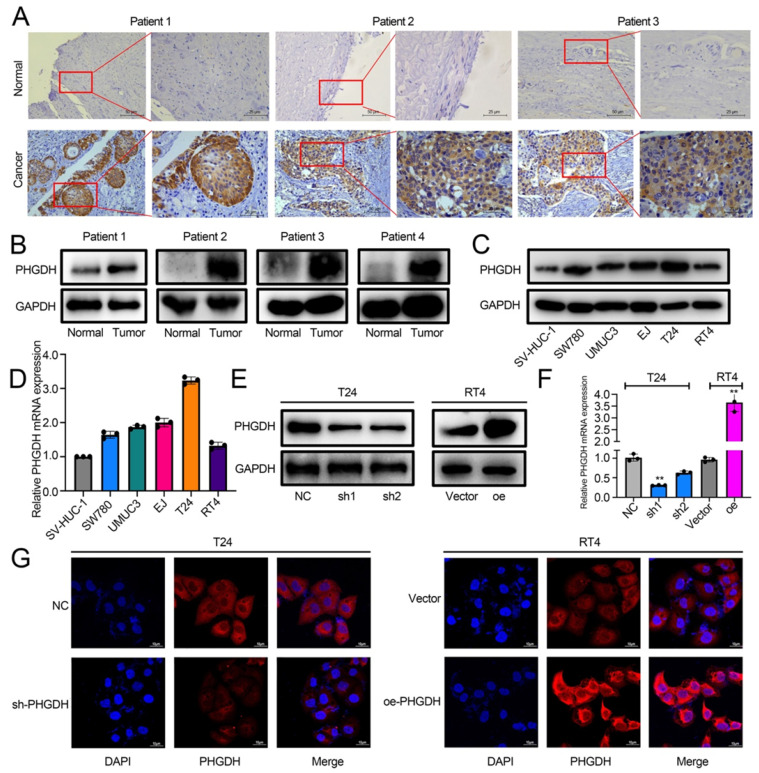
Figure 2.
PHGDH expression was upregulated significantly in BCa. (A) The IHC images detailing the PHGDH expression in the tumor and normal tissues (n = 5), Scale bars: 50/25 μm. (B-C) Western blots describing the PHGDH expression in BCa tissues and cell lines. (D) A qPCR technique was used for determining the PHGDH expression in BCa cell lines. (E-F) Western blot and qPCR were used for validating the effectiveness of gene knock-down and PHGDH over-expression. (G) The immunofluorescence images for knock-down and PHGDH over-expression. Scale bars: 10 μm. *p<0.05, **p<0.01, ***p<0.001.

