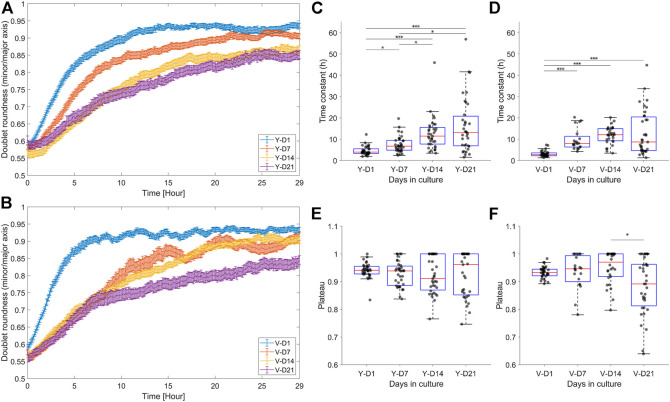
FIGURE 6.
Dynamic response of the doublet roundness and the distribution of the extracted fusion parameters. (A,B) Average response ±SEM of the doublet roundness for the different levels of maturation, respectively, for the Y and V pools. (C,D) Box plot of the fusion rate parameter, i.e., the time constant, respectively, for the Y and V pools. (E,F) Box plot of the fusion quality parameter, i.e., the plateau, respectively, for the Y and V pools. Data were compared with Kruskal–Wallis and Dunn–Sidak post hoc tests. Significance was visualized with *p < 0.05; **p < 0.01; ***p < 0.001.

