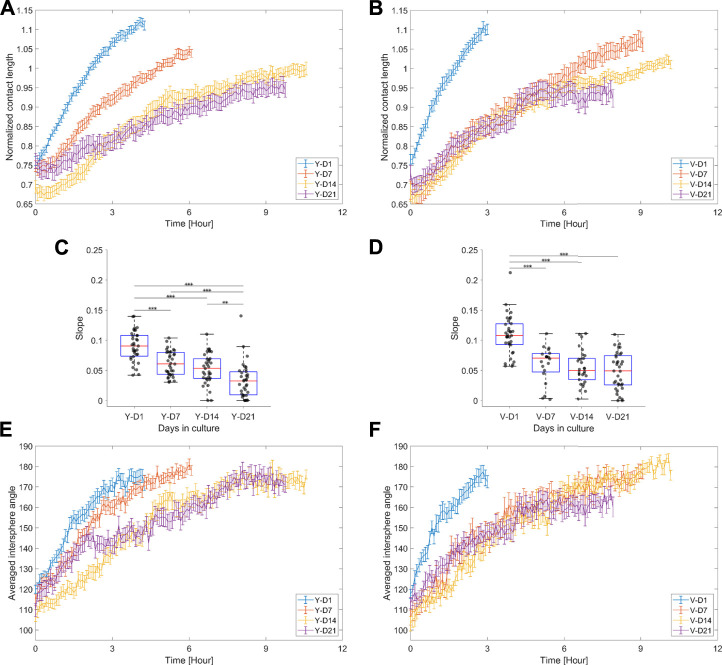
FIGURE 7.
Normalized contact length and averaged intersphere angle. (A,B) Average response ±SEM of the normalized contact length for the different maturation stages, respectively, for the Y and V pools. (C,D) Box plots of the integration rate, i.e., the slope extracted from the linear model fit on the normalized contact length (data up to 5 h were considered), for the different maturation stages, respectively, for the Y and V pools. Data were compared with one-way ANOVA and the Tukey–Kramer post hoc test. Significance was visualized with *: p < 0.05; **: p < 0.01; ***: p < 0.001. (E,F) Average response ±SEM of the averaged intersphere angle for the different levels of maturation, respectively, for the Y and V pools. 20–35 doublet samples were analyzed per condition.

