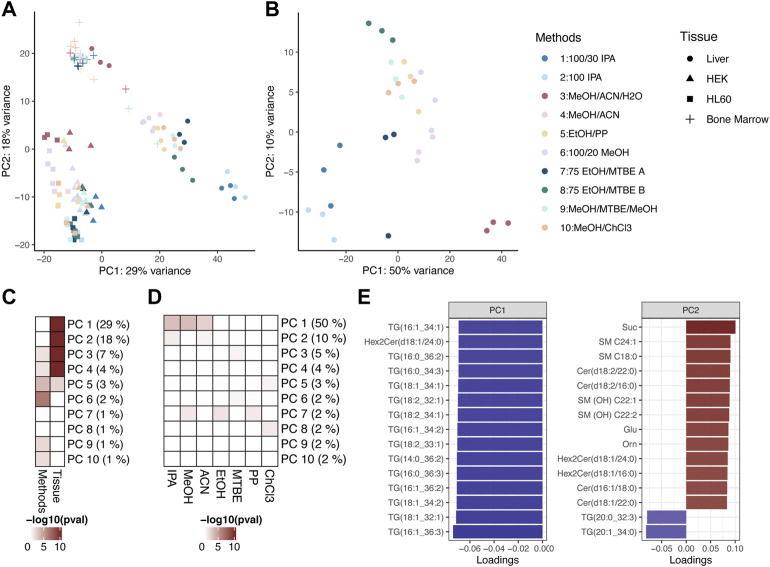
FIGURE 5.
(A) PCA of the ten different extraction protocols used across all sample types. (B) PCA of the ten different extraction protocols used on liver tissue samples. Colors encode metabolite classes as in (B). (C) Heatmap showing association strength between PCs and experimental setting (extraction protocol or tissue), color coding by the p-value of the Kruskal-Wallis test. (D) Heatmap showing association strength between PCs and solvents used in extraction protocols, color coding by the p-value of the Kruskal–Wallis test. (E) Barplot of the 15 highest (ranked by absolute value) loadings for PC1 and PC2. The color encodes the signs of the loadings.

