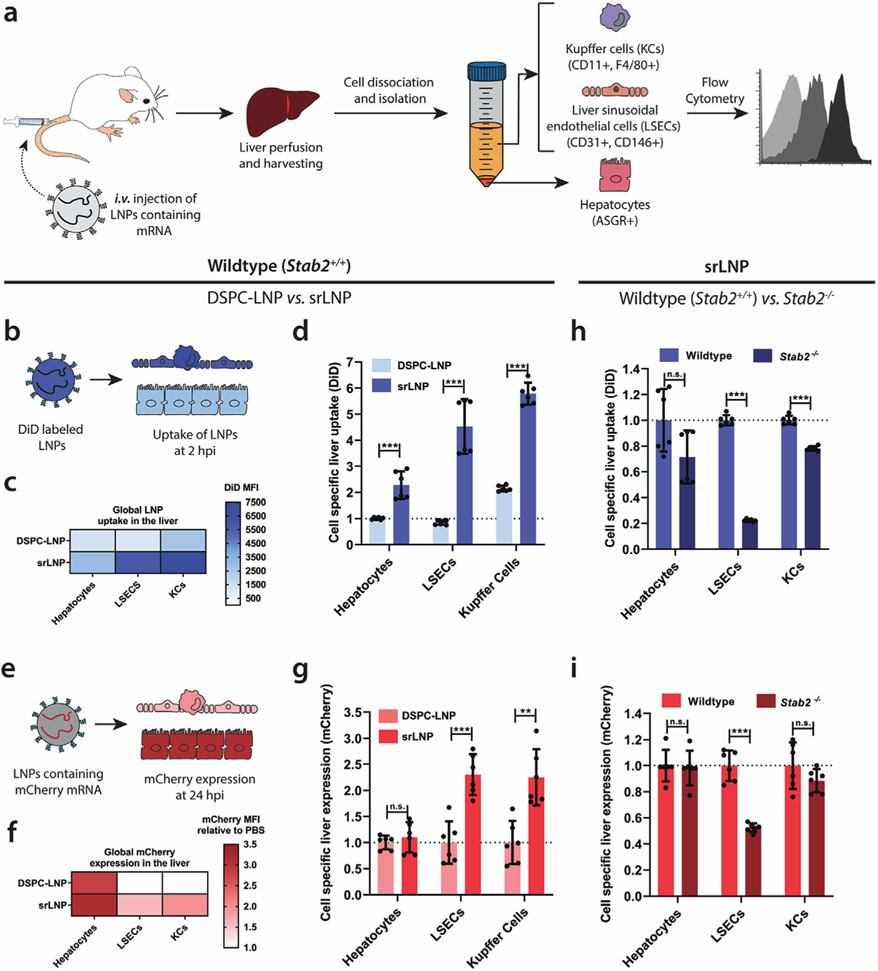
Figure 6.
LNP uptake and functional mRNA delivery within different hepatic cell types following i.v. administration in mice. a) Schematic illustrating the procedure to isolate different hepatic cell types and determine LNP–mRNA targeting and functional mRNA delivery. Following intravenous LNP–mRNA injection (i.v.) the liver was perfused with collagenase IV, hepatic cells were isolated and stained with specific antibodies, and flow cytometry was used to analyze LNP uptake and gene expression. Specific antibody markers used to uniquely identify hepatocytes, LSECs and KCs, respectively, are defined in parentheses. b) For intrahepatic biodistribution studies, LNPs contained DiD (0.5 mol%) as fluorescent lipid probe. Cellular uptake of DSPC–LNP and srLNP was assessed following mouse sacrifice at 2 hpi. Injected dose: 42.75 mg kg−1 total lipid. c) Heatmap of global LNP uptake in the liver determined by absolute DiD fluorescence. srLNP demonstrated significantly enhanced LNP uptake within all hepatic cell types, and significant redirection to hepatic RES compared to DSPC–LNPs. d) Cell-specific liver uptake normalized to DSPC–LNP in liver hepatocytes. e) For gene expression experiments, LNPs contained capped, mCherry–mRNA. Functional mRNA delivery was assessed based on mCherry fluorescence levels following mouse sacrifice at 24 hpi. f) Heatmap of mCherry expression in different liver cell types following functional mRNA delivery using DSPC–LNP and srLNP. Injected dose: 0.25 mg kg−1 mRNA. g) Cell-specific mCherry expression normalized to DSPC–LNP for each cell type. h) Cell-specific liver uptake of srLNP in wild-type and mutant stab2−/− KO mice, normalized to srLNP in wild-type for each cell type. i) Cell-specific liver expression of srLNP in wild-type and mutant stab2−/− KO mice, normalized to srLNP in wild-type for each cell type. In all cases, n = 6; representing 3 separate liver tissue samples from 2 mice sorted into individual cell types. Bars and error bars in (d) and (g) represent mean ± s.d. The data were normalized to the average uptake and expression of DSPC–LNPs within each cell type. Statistical significance was evaluated using a two-tailed unpaired Student’s t-test. n.s. = not significant p > 0.01, * p < 0.01, ** p < 0.01, *** p < 0.001. Exact p values for (d): hepatocytes p = 0.000147, LSECs p = 6.20 × 10⁻⁶, KCs p = 1.65 × 10⁻⁹. Exact p values for (g): hepatocytes p = 0.464, LSECs p = 0.000215, KCs p = 0.00113. Exact p values for (h): hepatocytes p = 0.0531, LSECs p = 5.62 × 10⁻¹³, KCs p = 5.78 × 10⁻⁸. Exact p values for (i): hepatocytes p = 0.808, LSECs p = 2.33 × 10⁻⁶, KCs p = 0.188.

