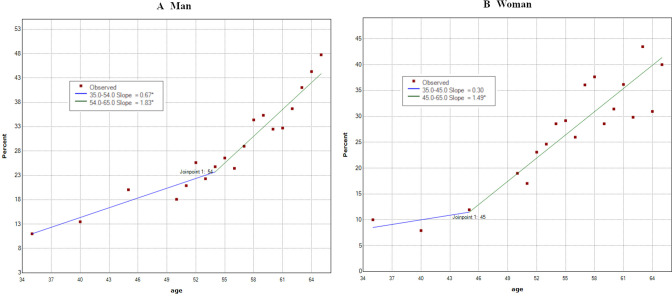
Figure 3.
Infection rates of Helicobacter pylori according to age in 2018 (men: n=9580; women: n=1854). Infection rates increased in two trends. (A) Men: first trend: 35–54 years (slope=0.67); second trend: 54–65 years (slope=1.83). (B) Female: first trend: 35–45 years (slope=0.30); second trend: 45–65 years (slope=1.49). ‘*’ in the graph legend indicates a significant difference in the slope from 0 at the alpha=0.05 level.

