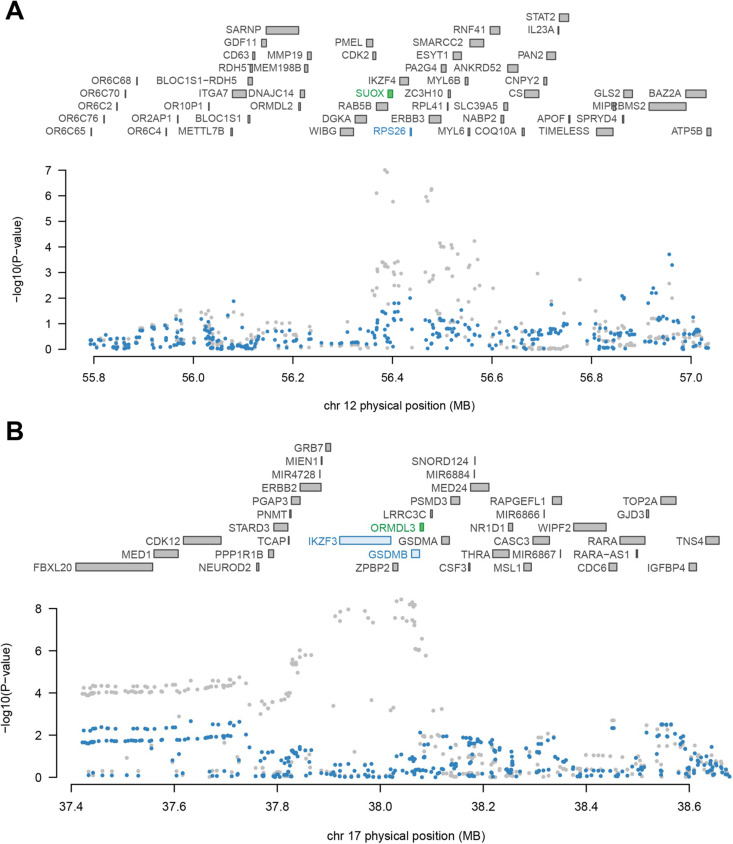
Figure 2.
Regional association of transcriptome-wide association study (TWAS) hits. (A) Chromosome 12q13.2 regional association plot. (B) Chromosome 17q21.1 regional association plot. The top panel highlights all genes in the region. The marginally associated TWAS genes are shown in blue, and the jointly significant genes are shown in green. The bottom panel show a regional Manhattan plot of the genome-wide association study (GWAS) data before (grey) and after (blue) conditioning on the predicted expression of the green genes.

