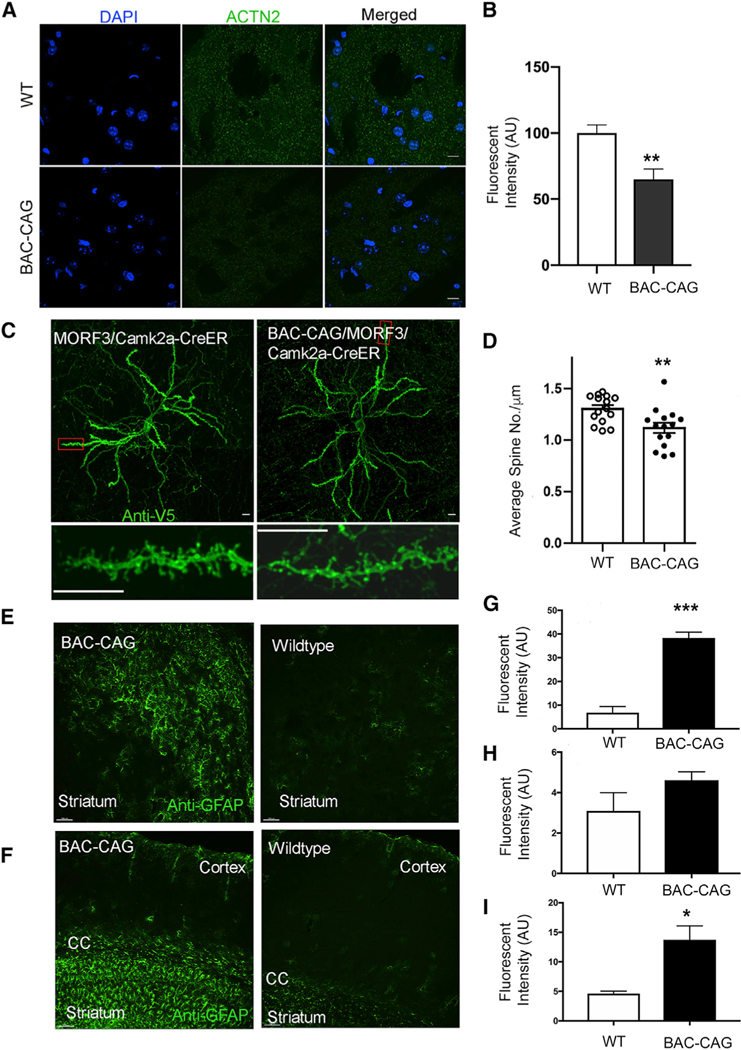
Figure 2. Neurodegenerative pathology changes in 12-month-old BAC-CAG mice.
(A and B) Significant reduction of Actn2(+) intensity in striatum of 12-month BAC-CAG mice. Results are shown as mean ± SEM from 5 brains for each group; *p < 0.05. Unpaired t test. Scale bars, 10 mm.
(C and D) Significant spine loss in striatal medium spiny neurons in 12-month-old BAC-CAG mice. Representative micrographs of striatum. Results are shown as mean ± SEM from 15 neurons from 3 mice for each group; **p < 0.01. Scale bars, 10 mm.
(E–I) Representative images of GFAP immunohistochemical staining of striatum (E) and cortex/corpus callosum (F) in WT and BAC-CAG brains. Quantification of the intensities of GFAP staining for striatum (G), cortex (H), and corpus callosum (I) is shown. Results are shown as mean ± SEM from 3 brains for each group. **p < 0.005. Unpaired t test. Scale bars, 20 μm in (E) and 100 μm in (F). See also Figure S3.

