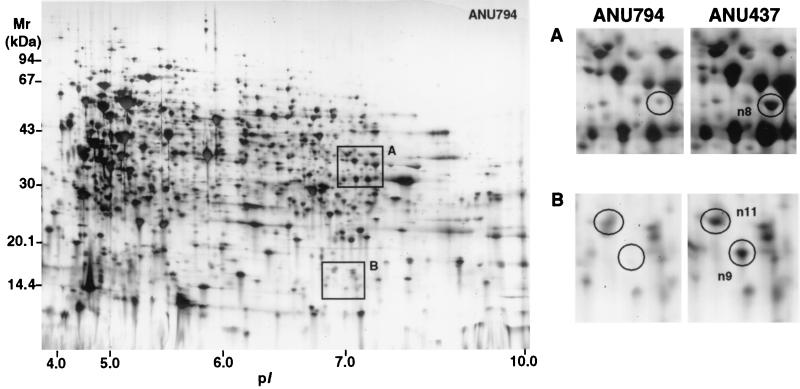
FIG. 3.
2-D protein array of proteins expressed in ANU794 and resolved in the pI range of 3 to 10. The framed areas are enlarged and represent regions on the map where reproducible spot differences were identified between ANU794 and ANU437. The differentially displayed proteins are circled and assigned arbitrary numbers.

