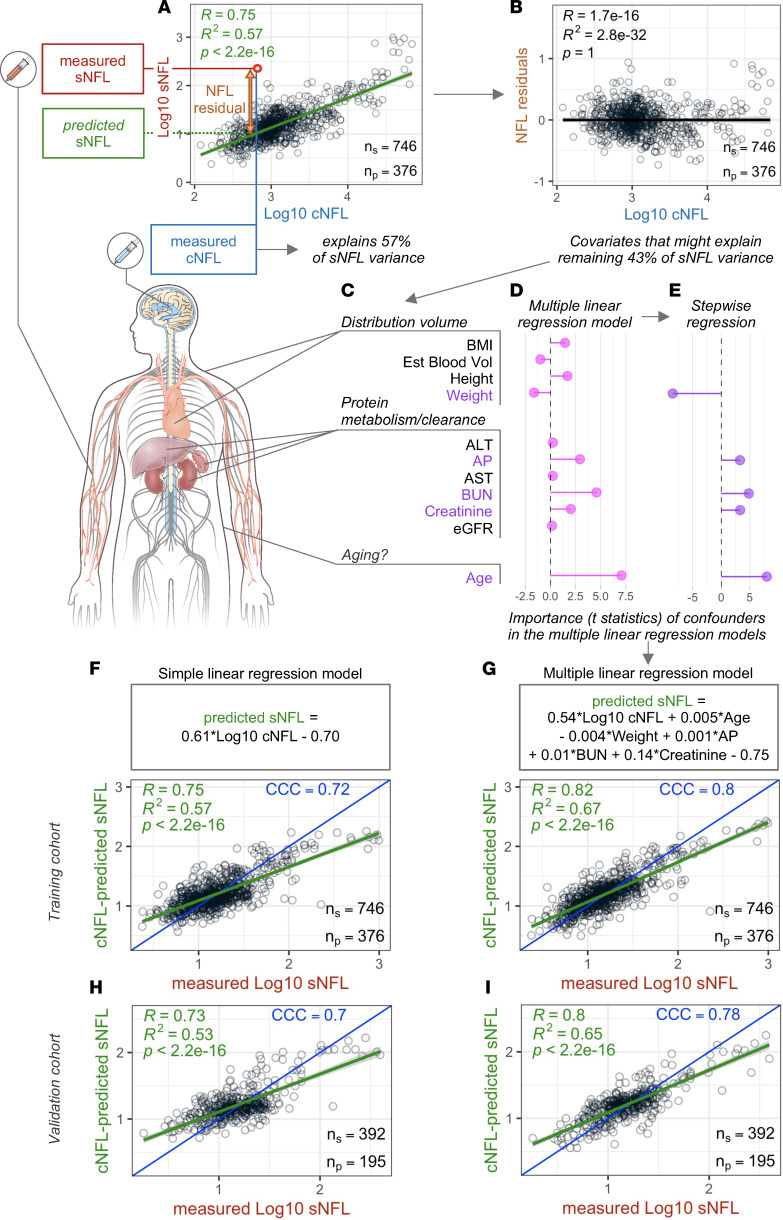
Figure 1. Variance between sNFL and cNFL concentrations.
(A) Linear regression model between log10-transformed concentration (pg/mL) of sNFL and cNFL in the training cohort of samples where cNFL levels explain 57% of variance of sNFL levels. (B) Remaining 43% of variance shown as NFL residuals generated as differences between measured sNFL concentration and predicted sNFL concentration calculated from measured cNFL using linear regression model. (C) Eleven potential confounders related to distribution volume (BMI = body mass index, Est Blood Vol = estimated blood volume, height, and weight), protein metabolism/clearance (ALT = alanine transaminase, AP = alkaline phosphatase, AST = aspartate transaminase, BUN = blood urea nitrogen, creatinine, and eGFR = estimated glomerular filtration rate), and age were used as explanatory variables in a multiple linear regression model resulting in varied importance represented as a t statistic of each variable in the model (D). Stepwise regression resulted in retention of 5 confounders in the model (E) that showed increased correlation between measured and predicted sNFL levels both in the training (G) and in the validation (I) cohort in comparison with correlations between measured and predicted values using a simple linear regression model in the same training (F) and validation cohort (H). Confounders in color are the ones selected in the multiple linear regression model that underwent stepwise regression. Green line represents linear regression model with gray shading corresponding to 95% confidence interval. ns, number of samples measured; np, number of patients represented by the samples; CCC, concordance correlation coefficient.

