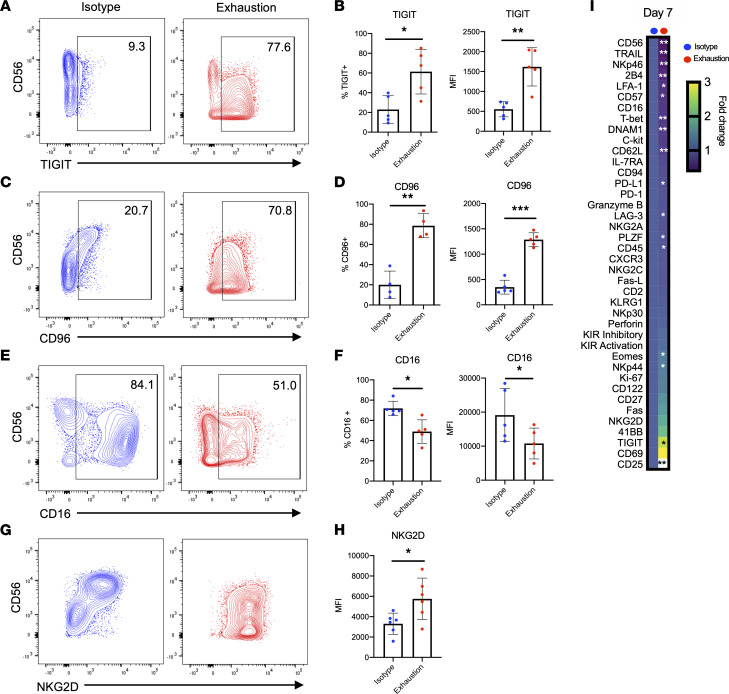
Figure 2. Prolonged stimulation through activating receptors alters expression of activating and inhibitory receptors.
(A–H) NK cells were harvested from isotype-coated and exhaustion plates (day 7), and expression of TIGIT (A and B) (n = 5), CD96 (C and D) (n = 3, n = 5), CD16 (E and F) (n = 5), and NKG2D (G and H) (n = 6) was measured via flow cytometry. (I) At day 7 of stimulation, cells from 3 donors were analyzed via mass cytometry (CyTOF). Heatmap indicates fold change relative to isotype mean metal intensity. Markers are ordered from most downregulated to most upregulated relative to control. Paired t tests were used for comparisons (n = 3). *P < 0.05; **P < 0.01; ***P < 0.001.

