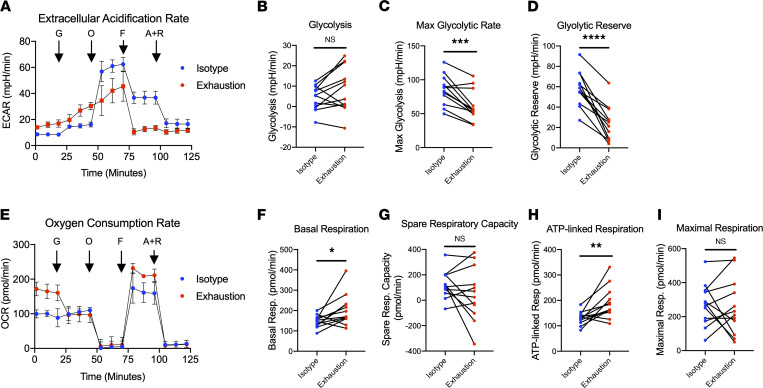
Figure 4. Prolonged stimulation through activating receptors alters the glycolytic and oxidative metabolism of NK cells.
(A) NK cells harvested from isotype-coated and exhaustion plates (day 7) were immobilized on tissue culture plates and subjected to live cell metabolic assays using Agilent’s Seahorse XFe24 Analyzer. Extracellular acidification rates (ECARs) were measured following injection of glucose (G), oligomycin (O), FCCP (F), and antimycin A + rotenone (A+R). (B–D) Graphical representations of glycolysis (B), maximum glycolytic rate (C), and glycolytic reserve (D) are pictured (n = 12). (E) OCRs were measured following injection of glucose (G), oligomycin (O), FCCP (F), and antimycin A + rotenone (A+R). (F–I) Graphical representations of basal respiration (F), spare respiratory capacity (G), ATP-linked respiration (H), and maximal respiration (I) are pictured (n = 12). Paired t tests were used for comparisons. *P ≤ 0.05; **P < 0.01; ***P < 0.001; ****P < 0.0001.

