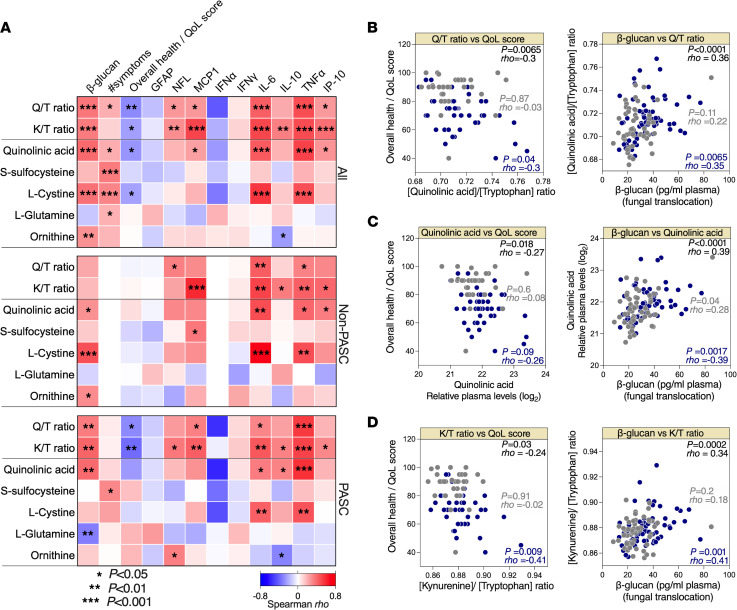
Figure 6. Levels of plasma host metabolites correlate with inflammation during PASC.
(A) Three correlation heatmaps showing associations between Q/T ratio, K/T ratio, and levels of selected metabolites (in rows) to levels of plasma β-glucan, the number of symptoms during PASC, overall health/QoL score, and plasma levels of several inflammatory markers (in columns) measured in all (n = 117; top), non-PASC (n = 56; middle), and PASC (n = 61; bottom) individuals from the UCSF LIINC cohort. The color of the square represents the strength of the Spearman’s rank correlation, with blue shades representing negative correlations and red shades representing positive correlations. *P < 0.05; **P < 0.01; ***P < 0.001. (B) Examples of the correlations between Q/T ratio and overall health/QoL score or β-glucan. (C) Examples of the correlations between quinolinic acid and overall health/QoL score or β-glucan. (D) Examples of the correlations between K/T ratio and overall health/QoL score or β-glucan. Spearman’s rank correlation tests were used for statistical analysis. Blue = PASC, and gray = non-PASC in B–D.

