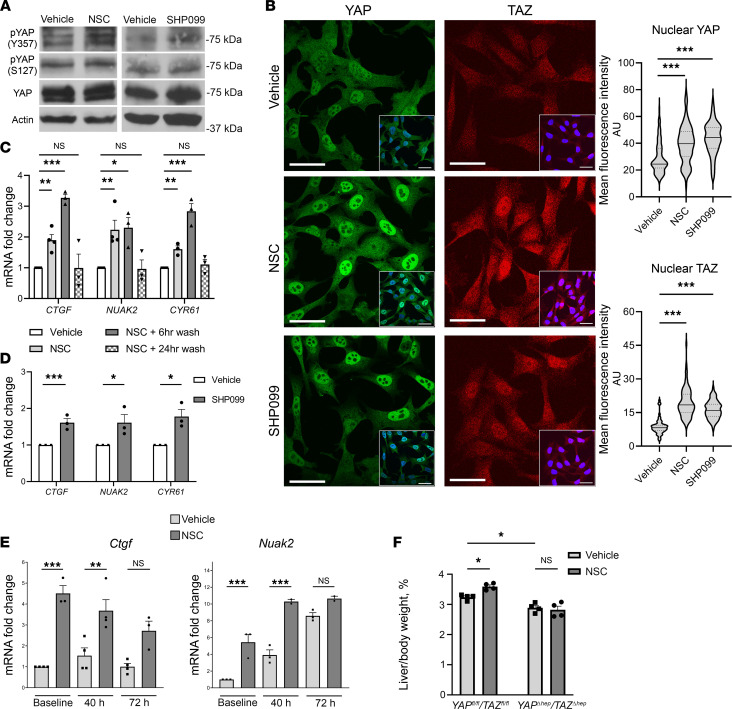
Figure 2. SHP2 inhibition activates YAP/TAZ in vitro and in vivo.
(A) Hu1545 whole cell lysates treated with vehicle, NSC (1 μM for 24 hours), or SHP099 (1 μM for 24 hours) probed for pYAPY357, pYAPS127, total YAP, and actin as a loading control. (B) Representative image of YAP and TAZ immunofluorescence stains in Hu1545 treated with vehicle, NSC (1 μM), or SHP099 (1 μM). Inset image with DAPI overlay. Scale bar: 50 μm for both inset and main image. YAP and TAZ mean fluorescence intensity (MFI) from 75 to 100 nuclei/condition plotted as a violin plot (solid line, median; dashed line, upper or lower quartile). (C) Hu1545 YAP/TAZ target gene expression (CTGF, NUAK2, and CYR61) following treatment with vehicle, NSC (1 μM for 24 hours), and NSC with 6- or 24-hour washout (n = 3–4). Data are shown as mean ± SEM. (D) Hu1545 YAP/TAZ target gene expression in vehicle- or SHP099-treated cells (1 μM for 24 hours) (n = 3). (E) YAP/TAZ target genes Ctgf and Nuak2 from livers treated with vehicle or NSC at baseline (resection specimen), 40, and 72 hours after hepatectomy (n = 3). (F) Mean liver/body weight ratio 72 hours after hepatectomy in Yapfl/fl/Tazfl/fl and YapΔhep/TazΔhep mice treated with vehicle or NSC (n = 4). Data are shown as mean ± SEM unless otherwise specified (*P < 0.05, **P < 0.01, ***P < 0.001). Statistical analysis was performed with 1-way ANOVA (B, C, E, and F) and 2-tailed Student t test (C).

