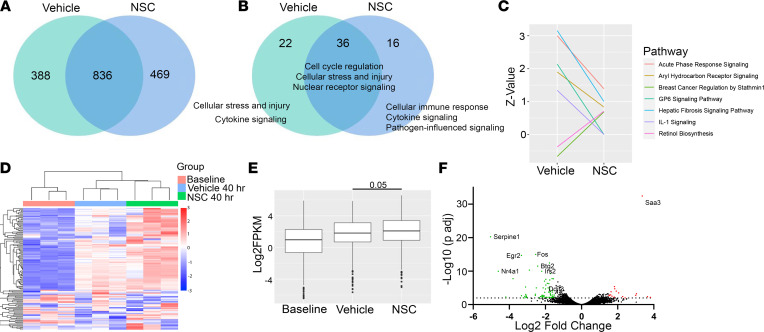
Figure 3. SHP2 inhibition induces a proregenerative transcriptional profile.
(A) Venn diagram of differentially regulated genes (–1.5 < log2 fold change > 1.5, FDR < 5%) in murine liver lysates comparing baseline to 40 hours after hepatectomy in vehicle- and NSC-treated mice (n = 3). (B) Common function of IPA canonical pathways significantly changed (–log10 P > 1.3) 40 hours after hepatectomy from baseline in vehicle- and NSC-treated mice. The most common functions identified are listed. The full pathway analysis is provided in Supplemental Table 1. (C) IPA canonical pathway activation scores (Z score) in pathways in which the pathway was significantly changed from baseline (–log10 P > 1.3), and the Z score changed by greater or less than 1 and –1, respectively. (D) Cell cycle gene set heatmap at baseline (vehicle resection specimen) and 40 hours after hepatectomy in mice treated with vehicle or NSC. Each column represents an individual biological replicate. (E) Box and whisker plot (median and IQR) log2FPKM of cell cycle gene transcripts from heatmap in E. (F) Volcano plot comparing gene expression 40 hours after hepatectomy in vehicle- and NSC-treated mice (3 biological replicates/group). Significantly differentially expressed genes (–1.5 < log2FC > 1.5, FDR < 5%) highlighted green (downregulated) and red (upregulated) with top genes identified on plot. Statistical analysis was performed using Wilcoxon rank sum test with continuity correction (E).

