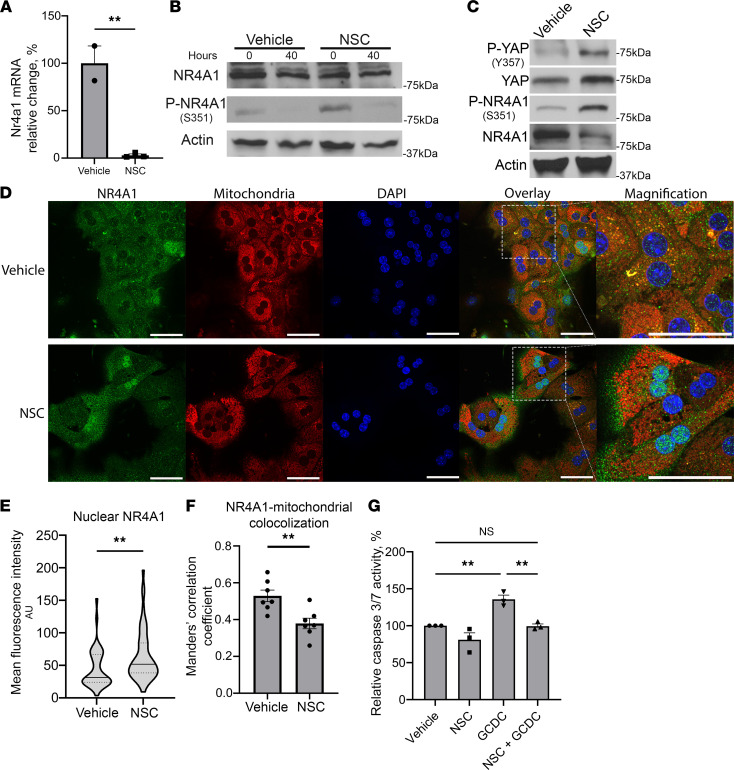
Figure 4. NR4A1 in modulated by NSC in vitro and in vivo.
(A) Nr4a1 mRNA relative expression 40 hours after hepatectomy in vehicle- and NSC-treated mice (n = 3). Data are shown as mean ± SEM. (B) Liver lysates from resection specimen (0 hours) and 40 hours after hepatectomy probed for NR4A1, pNR4A1S351, and actin as a loading control in vehicle- and NSC-treated mice. (C) Primary mouse hepatocytes treated with NSC (10 μM) or vehicle for 24 hours and immunoblotted for pYAPY357, total YAP, pNR4A1S351, total NR4A1, and actin as a loading control. (D) Representative images of NR4A1 immunocytochemistry with mitochondrial (MitoTracker) and nuclei (DAPI) counterstains in isolated mouse hepatocytes treated with NSC (10 μM) or vehicle. Scale bars: 50 μm. (E) Mean fluorescence intensity (MFI) values for nuclear NR4A1 in NSC- (10 μM) or vehicle-treated hepatocytes. Median values represented by solid line, and IQR represented by dotted lines. In total, 35–50 nuclei were evaluated. (F) Mean Manders’ correlation coefficient of NR4A1 colocalized to mitochondria in vehicle- and NSC-treated hepatocytes. Correlation coefficient were calculated for 7 images (400×). Data are shown as mean ± SEM. (G) Relative caspase 3/7 activity in primary mouse hepatocytes 4 hours after glycochenodeoxycholate (GCDC) (50 μM) or vehicle treatment with or without NSC pretreatment (10 μM) for 16 hours, n = 3 (*P < 0.05, **P < 0.01). B and C are representative immunoblots from 2 independent experiments. Statistical analysis was performed with 2-tailed Student t test (E and F) and 1-way ANOVA (G).

