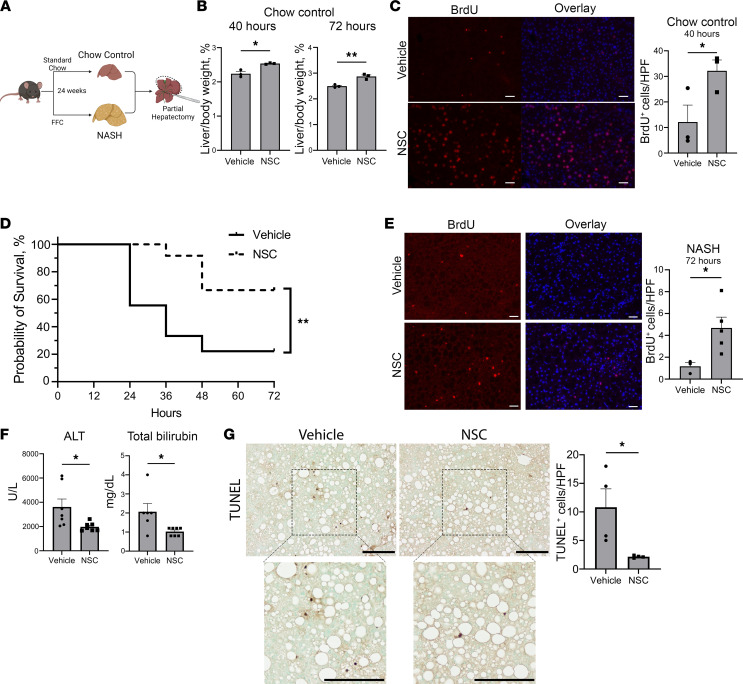
Figure 5. NSC improves postoperative mortality in murine NASH model.
(A) NASH induction with a high-fat, -cholesterol, -glucose/sucrose diet (FFC). (B) Mean chow control mouse liver/body weight ratio 40 and 72 hours after hepatectomy (n = 3). (C) Representative BrdU immunofluorescence staining in liver sections 40 hours after hepatectomy in vehicle- and NSC-treated chow control mice (n = 3). Scale bar: 100 μm. DAPI-counterstained cells overlayed with BrdU with quantified BrdU+ hepatocyte nuclei per 10 HPF (200×). (D) Kaplan-Meier survival curve after hepatectomy in mice with NASH in vehicle- (n = 18) or NSC-treated (n = 12) mice. Statistical analysis was performed using the log rank (Mantel-Cox) test. (E) Representative BrdU immunofluorescence staining in liver sections 72 hours after hepatectomy in vehicle- and NSC-treated NASH mice (n = 3). Scale bar: 100 μm. DAPI-counterstained cells overlayed with BrdU. Quantified BrdU+ hepatocyte nuclei per 10 HPF (200×). (F) Plasma ALT and total bilirubin in NASH mice treated with vehicle or NSC 4 hours after hepatectomy (n = 6–7). (G) Representative image of TUNEL IHC in vehicle or NSC-treated NASH mice 4 hours after hepatectomy with magnified view. Scale bars: 200 μm. TUNEL+ hepatocytes were quantified in 10 HPF (100×) for each mouse (n = 4). Data are shown as mean ± SEM (*P < 0.05, **P < 0.01). Statistical analysis was performed with 2-tailed Student t test, unless otherwise specified.

